SARS 2003 epidemic in Hong Kong
Image 
In 2003 there is an outbreak of SARS (Severe acute respiratory syndrome) in China that spreads to Hong Kong and then to the entire world. The following map shows the number of cases in the different countries:

ID:(9662, 0)
SIR model to describe SARS 2003 in Hong Kong
Image 
If the susceptible, infected and 'recovered' (who heal or die) are observed, the typical curves of the SIR model are observed:

ID:(9663, 0)
SARS 2003 epidemic analysis in Hong Kong
Image 
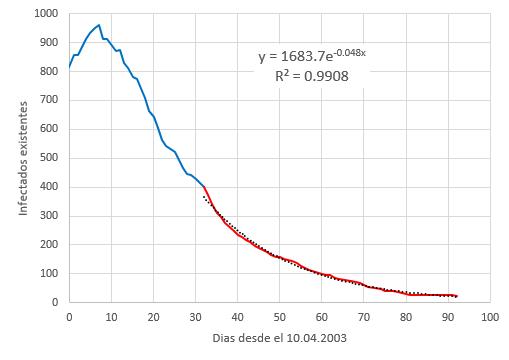
If the WHO data for the SARS epidemic in 2003 in Hong Kong is studied, the current number of infected

\\n\\nEven if you do not have the beginning section, you can see the maximum typical of the number of infected when you start to control them and it is given that\\n\\n
\displaystyle\frac{dS}{dt}=\left(\displaystyle\frac{\beta C}{N}S-\gamma\right)I=0
\\n\\nso that those susceptible at that point reach\\n\\n
S=\displaystyle\frac{\gamma}{\beta C}N
ID:(8202, 0)
2003 SARS Parameter Determination in Hong Kong
Image 
If you study the way in which the infected descend, it is seen that as time progresses, the term gamma must dominate since it is the one that reduces the total volume described by the first term. That is why it is necessary for times when the epidemic is under control\\n\\n
\displaystyle\frac{dI}{dt}=\left(\displaystyle\frac{\beta C}{N}S-\gamma\right)I\sim-\gamma I
\\n\\nIn that case the asymptomatic solution is of the form\\n\\n
I(t) \propto e^{-\gamma t}
what can be seen in the existing infected curve for the SARS 2003 case in Hong Kong. Therefore, a minimum square adjustment of the final part of the curve can be made

\\n\\nobtaining that the factor
\tau=\displaystyle\frac{1}{\gamma}\sim 20.8,dias
If we also assume that each person meets on a daily basis with the order of 30 people, the
ID:(8203, 0)
Mortality rate
Image 
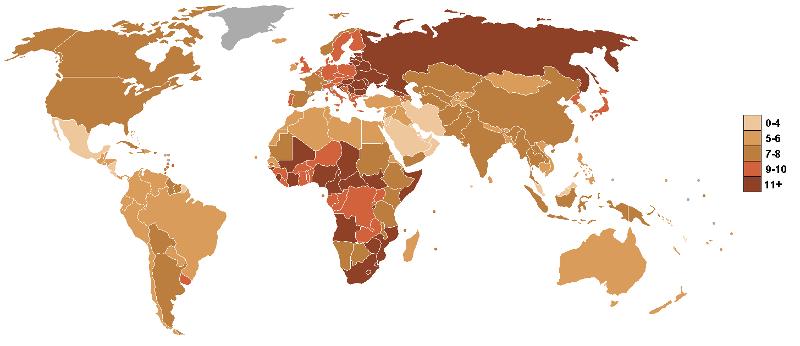
World mortality is different depending on the country in the world. While in developed countries it reaches values lower than 5 deaths per 1000 inhabitants and year in underdeveloped countries it reaches more than 11:

The factor demanded by the model is the probability per day that a person dies. In other words, the number of daily deaths (cases favorable to the hypothesis) must be taken and divided by the number of people alive. In this way, if the
ID:(8217, 0)
Birth Rate
Image 
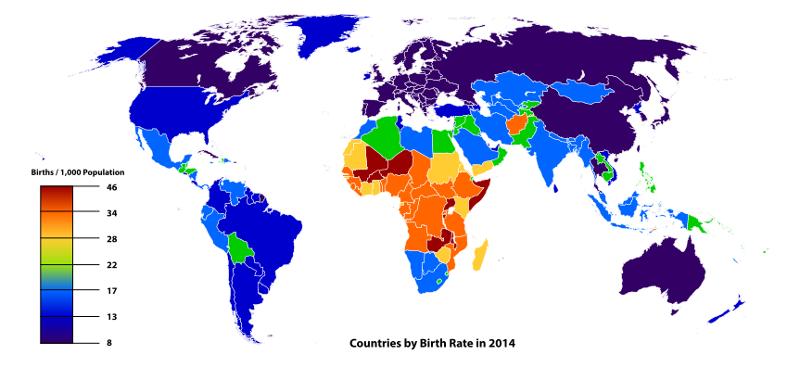
World birth is different depending on the country of the world. While in developed countries it reaches values below 15 births per 1000 inhabitants and year in underdeveloped countries it reaches 46:

The factor demanded by the model is the probability per day that a person is born. In other words, the number of daily births (cases favorable to the hypothesis) must be taken and divided by the number of people alive. In this way, if the
ID:(8216, 0)
SIR simulator
Php 
The SIR simulator allows defining the parameters of a SIR model and observing its evolution:
ID:(9656, 0)
SEIR simulator
Php 
The SEIR simulator allows defining the parameters of a SEIR model and observing its evolution:
ID:(9657, 0)
SEIR-long term simulator
Php 
The SEIR-long term simulator allows defining the parameters of a SEIR model and observing its evolution:
ID:(9658, 0)
SARS simulator - adjustment of a SEIR Model
Php 
This simulator contains the SARS epidemic data for the case of Hong Kong and allows searching the parameters of a SEIR model by adjusting the curves to the actual values:
ID:(9659, 0)
