Modelo para Acciones (RNN)
Storyboard 
El modelo de acciones toma segmentos históricos y el valor que los sigue y busca reconocer el patrón para luego de cualquier secuencia inferir como continuará.
Código y datos
ID:(1792, 0)
Importar librerias
Descripción 
Importar las librerías necesarias:
# importing the libraries
import numpy as np
import matplotlib.pyplot as plt
import pandas as pd
import warnings
warnings.filterwarnings('ignore')
ID:(13872, 0)
Cargar los datos
Descripción 
Cargar precios de acciones históricos de google:
# load stock prices
dataset_train = pd.read_csv('stock_price_train.csv')
print(dataset_train)
Date Open High Low Close Volume
0 1/3/2012 325.25 332.83 324.97 663.59 7,380,500
1 1/4/2012 331.27 333.87 329.08 666.45 5,749,400
2 1/5/2012 329.83 330.75 326.89 657.21 6,590,300
3 1/6/2012 328.34 328.77 323.68 648.24 5,405,900
4 1/9/2012 322.04 322.29 309.46 620.76 11,688,800
... ... ... ... ... ... ...
1253 12/23/2016 790.90 792.74 787.28 789.91 623,400
1254 12/27/2016 790.68 797.86 787.66 791.55 789,100
1255 12/28/2016 793.70 794.23 783.20 785.05 1,153,800
1256 12/29/2016 783.33 785.93 778.92 782.79 744,300
1257 12/30/2016 782.75 782.78 770.41 771.82 1,770,000
[1258 rows x 6 columns]
ID:(13873, 0)
Extraer precios de apertura
Descripción 
Formar arreglo con los datos de los precios de apertura de la acción:
# extract opening prices
train = dataset_train.loc[:, ['Open']].values
train
array([[325.25],
[331.27],
[329.83],
...,
[793.7 ],
[783.33],
[782.75]])
ID:(13874, 0)
Re-escalar valores
Descripción 
Para mejorar la calidad del aprendizaje se procede a re-escalar los valores entre 0 y 1:
# feature scaling
from sklearn.preprocessing import MinMaxScaler
scaler = MinMaxScaler(feature_range = (0, 1))
train_scaled = scaler.fit_transform(train)
train_scaled
array([[0.08581368],
[0.09701243],
[0.09433366],
...,
[0.95725128],
[0.93796041],
[0.93688146]])
ID:(13875, 0)
Mostrar valores
Descripción 
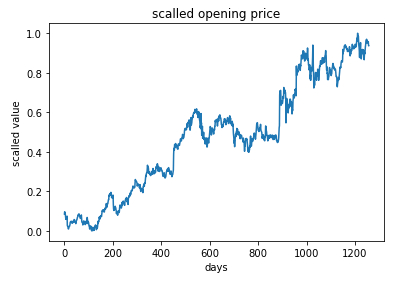
Los valores se pueden representar en el tiempo:
# show data
plt.plot(train_scaled)
plt.title('scalled opening price')
plt.xlabel('days')
plt.ylabel('scalled value')
plt.show()

ID:(13876, 0)
Crear segmentos
Descripción 
Para modelar se extraen 1208 secuencias de 50 valores X_train y el valor que le sigue y_train:
# creating a data structure with 50 timesteps and 1 output
X_train = []
y_train = []
timesteps = 50
for i in range(timesteps, 1258):
    X_train.append(train_scaled[i-timesteps:i, 0])
    y_train.append(train_scaled[i, 0])
X_train, y_train = np.array(X_train), np.array(y_train)
ID:(13877, 0)
Re-ordenar valores
Descripción 
Reordenar los valores de entrenamiento train con la función np.reshape:
# reshaping
X_train = np.reshape(X_train, (X_train.shape[0], X_train.shape[1], 1))
print(X_train.shape[0],',',X_train.shape[1],',',y_train.shape[0])
print('X_train=',X_train)
print('y_train=',y_train)
1208 , 50 , 1208
X_train= [[[0.08581368]
[0.09701243]
[0.09433366]
...
[0.03675869]
[0.04486941]
[0.05065481]]
...
[[0.96569685]
[0.97510976]
[0.95966962]
...
[0.95163331]
[0.95725128]
[0.93796041]]]
y_train= [0.05214302 ... 0.93688146]
ID:(13878, 0)
Definir, formar y entrenar modelo
Descripción 
El modelo se define como un modelo secuencial Sequential(), se agregan cuatro capas SimpleRNN con la función add y una capa final de un solo elemento. El modelo se procede a estructurar con el comando compile para luego entrenarlo con el comando fit:
# importing the Keras libraries and packages
from keras.models import Sequential
from keras.layers import Dense
from keras.layers import SimpleRNN
from keras.layers import Dropout

# initialising the RNN
stock_regressor = Sequential()

# adding the first RNN layer and some Dropout regularisation
stock_regressor.add(SimpleRNN(units = 50,activation='tanh', return_sequences = True, input_shape = (X_train.shape[1], 1)))
stock_regressor.add(Dropout(0.2))

# adding a second RNN layer and some Dropout regularisation
stock_regressor.add(SimpleRNN(units = 50,activation='tanh', return_sequences = True))
stock_regressor.add(Dropout(0.2))

# adding a third RNN layer and some Dropout regularisation
stock_regressor.add(SimpleRNN(units = 50,activation='tanh', return_sequences = True))
stock_regressor.add(Dropout(0.2))

# adding a fourth RNN layer and some Dropout regularisation
stock_regressor.add(SimpleRNN(units = 50))
stock_regressor.add(Dropout(0.2))

# adding the output layer
stock_regressor.add(Dense(units = 1))

# compiling the RNN
stock_regressor.compile(optimizer = 'adam', loss = 'mean_squared_error')

# fitting the RNN to the Training set
stock_regressor.fit(X_train, y_train, epochs = 100, batch_size = 32)
Epoch 1/100
38/38 [==============================] - 17s 20ms/step - loss: 0.4512
Epoch 2/100
38/38 [==============================] - 1s 19ms/step - loss: 0.2486
Epoch 3/100
38/38 [==============================] - 1s 18ms/step - loss: 0.1825
...
Epoch 98/100
38/38 [==============================] - 1s 19ms/step - loss: 0.0021
Epoch 99/100
38/38 [==============================] - 1s 19ms/step - loss: 0.0022
Epoch 100/100
38/38 [==============================] - 1s 18ms/step - loss: 0.0022
ID:(13879, 0)
Cargar los datos para evaluar
Descripción 
Cargar precios de acciones de google para el 2017 de modo de compararlos con los precios pronosticados:
# load real stock prices (2017)
dataset_test = pd.read_csv('stock_price_test.csv')
print(dataset_test)
Date Open High Low Close Volume
0 1/3/2017 778.81 789.63 775.80 786.14 1,657,300
1 1/4/2017 788.36 791.34 783.16 786.90 1,073,000
2 1/5/2017 786.08 794.48 785.02 794.02 1,335,200
3 1/6/2017 795.26 807.90 792.20 806.15 1,640,200
4 1/9/2017 806.40 809.97 802.83 806.65 1,272,400
5 1/10/2017 807.86 809.13 803.51 804.79 1,176,800
6 1/11/2017 805.00 808.15 801.37 807.91 1,065,900
7 1/12/2017 807.14 807.39 799.17 806.36 1,353,100
8 1/13/2017 807.48 811.22 806.69 807.88 1,099,200
9 1/17/2017 807.08 807.14 800.37 804.61 1,362,100
10 1/18/2017 805.81 806.21 800.99 806.07 1,294,400
11 1/19/2017 805.12 809.48 801.80 802.17 919,300
12 1/20/2017 806.91 806.91 801.69 805.02 1,670,000
13 1/23/2017 807.25 820.87 803.74 819.31 1,963,600
14 1/24/2017 822.30 825.90 817.82 823.87 1,474,000
15 1/25/2017 829.62 835.77 825.06 835.67 1,494,500
16 1/26/2017 837.81 838.00 827.01 832.15 2,973,900
17 1/27/2017 834.71 841.95 820.44 823.31 2,965,800
18 1/30/2017 814.66 815.84 799.80 802.32 3,246,600
19 1/31/2017 796.86 801.25 790.52 796.79 2,160,600
ID:(13880, 0)
Extraer precios de apertura para evaluar
Descripción 
Formar arreglo con los datos de los precios de apertura de la acción para la evaluación:
# extract opening prices para evaluar
real_stock_price = dataset_test.loc[:, ['Open']].values
real_stock_price
array([[778.81],
[788.36],
[786.08],
[795.26],
[806.4 ],
[807.86],
[805. ],
[807.14],
[807.48],
[807.08],
[805.81],
[805.12],
[806.91],
[807.25],
[822.3 ],
[829.62],
[837.81],
[834.71],
[814.66],
[796.86]])
ID:(13881, 0)
Re-escalar valores para la evaluación
Descripción 
Para poder comparar se procede a escalar los valores de evaluación en el rango 0 y 1:
# getting the predicted stock price of 2017
dataset_total = pd.concat((dataset_train['Open'], dataset_test['Open']), axis = 0)
inputs = dataset_total[len(dataset_total) - len(dataset_test) - timesteps:].values.reshape(-1,1)
inputs = scaler.transform(inputs)  # min max scaler
inputs
array([[0.97510976],
[0.95966962],
[0.97808617],
...
[1.03354044],
[0.99624228],
[0.9631297 ]])
ID:(13882, 0)
Pronosticar precios
Descripción 
Se forma de los valores input los valores de testeo X_text y con la función predict se procede a pronosticar los valores:
X_test = []
for i in range(timesteps, 70):
    X_test.append(inputs[i-timesteps:i, 0])
X_test = np.array(X_test)
X_test = np.reshape(X_test, (X_test.shape[0], X_test.shape[1], 1))
predicted_stock_price = stock_regressor.predict(X_test)
predicted_stock_price = scaler.inverse_transform(predicted_stock_price)
print(predicted_stock_price)
[[791.3195 ]
[788.87964]
[789.0553 ]
[791.17883]
[793.6802 ]
[796.1757 ]
[798.198 ]
[799.31714]
[799.56616]
[799.31494]
[799.6199 ]
[799.514 ]
[798.5145 ]
[798.20874]
[798.54846]
[800.562 ]
[803.8723 ]
[807.5642 ]
[809.4684 ]
[807.31573]]
ID:(13883, 0)
Comparar valores pronosticados con reales
Descripción 
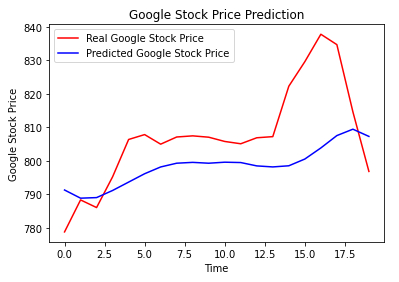
Finalmente se muestran los valores pronosticados y los reales:
# Visualising the results
plt.plot(real_stock_price, color = 'red', label = 'Real Google Stock Price')
plt.plot(predicted_stock_price, color = 'blue', label = 'Predicted Google Stock Price')
plt.title('Google Stock Price Prediction')
plt.xlabel('Time')
plt.ylabel('Google Stock Price')
plt.legend()
plt.show()\

ID:(13884, 0)
