Memoria a largo plazo a corto plazo (LSTM)
Storyboard 
El modelo de números de pasajeros toma segmentos históricos y el valor que los sigue y busca reconocer el patrón para luego de cualquier secuencia inferir como continuará.
Código y datos
international-airline-passengers.csv
ID:(1793, 0)
Importar librerias
Descripción 
Importar las librerías necesarias:
import numpy
import pandas as pd
import matplotlib.pyplot as plt
import math
from keras.models import Sequential
from keras.layers import Dense
from keras.layers import LSTM
from sklearn.preprocessing import MinMaxScaler
from sklearn.metrics import mean_squared_error
ID:(13885, 0)
Cargar datos históricos
Descripción 
Cargar los datos desde los datos international-airline-passengers.csv:
# load data
data = pd.read_csv('international-airline-passengers.csv',skipfooter=5)
data.head()

ID:(13886, 0)
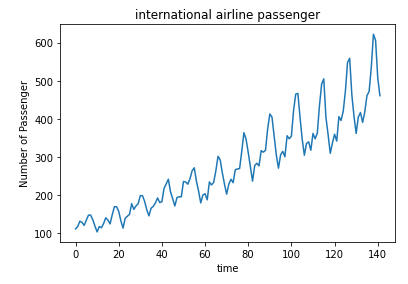
Mostrar los datos históricos
Descripción 
Mostrar los datos:
# show data
dataset = data.iloc[:,1].values
plt.plot(dataset)
plt.xlabel('time')
plt.ylabel('Number of Passenger')
plt.title('international airline passenger')
plt.show()

ID:(13887, 0)
Cambiar la forma y enumerar los datos
Descripción 
Cambiar la forma y enumerar los datos:
# reshape and list data
dataset = dataset.reshape(-1,1)
dataset = dataset.astype('float32')
print(dataset)
[[112.]
[118.]
[132.]
[129.]
...
[606.]
[508.]
[461.]]
ID:(13888, 0)
Re-escalar valores
Descripción 
Para mejorar la calidad del aprendizaje se procede a re-escalar los valores entre 0 y 1:
# scaling
scaler = MinMaxScaler(feature_range=(0, 1))
dataset = scaler.fit_transform(dataset)
print(dataset)
[[0.01544401]
[0.02702703]
[0.05405405]
...
[0.96911204]
[0.7799227 ]
[0.6891892 ]]
ID:(13889, 0)
Generar los datos de entrenamiento y evaluación
Descripción 
El arreglo inicial es segmentado en un grupo de registros para entrenar y un segundo para testear el modelo generado:
# generate train and test data
train_size = int(len(dataset) * 0.50)
test_size = len(dataset) - train_size
train = dataset[0:train_size,:]
test = dataset[train_size:len(dataset),:]
print('train size: {}, test size: {} '.format(len(train), len(test)))
print(train)
train size: 71, test size: 71
[[0.01544401]
[0.02702703]
[0.05405405]
...
[0.2992278 ]
[0.24131274]
[0.1911197 ]]
ID:(13890, 0)
Crear segmentos de entrenamiento
Descripción 
Se forman las secuencias X_train y el valor que le sigue y_train:
# creating a data structure with 10 timesteps and 1 output
time_stemp = 10
dataX = []
dataY = []
for i in range(len(train)-time_stemp-1):
    a = train[i:(i+time_stemp), 0]
    dataX.append(a)
    dataY.append(train[i + time_stemp, 0])
trainX = numpy.array(dataX)
trainY = numpy.array(dataY)
print('trainX:',trainX.shape[0],',',trainX.shape[1],' trainY:',trainY.shape[0])
print('trainX=',trainX)
print('trainY=',trainY)
trainX: 60 , 10 trainY: 60
trainX= [[0.01544401 0.02702703 0.05405405 0.04826255 0.03281853 0.05984557
0.08494207 0.08494207 0.06177607 0.02895753]
...
[0.18725869 0.19305018 0.16216215 0.25289574 0.23745173 0.25096524
0.3088803 0.38223937 0.36486486 0.2992278 ]]
trainY= [0. 0.02702703 0.02123553 0.04247104 0.07142857 0.05984557
...
0.25096524 0.3088803 0.38223937 0.36486486 0.2992278 0.24131274]
ID:(13891, 0)
Crear segmentos de evaluación
Descripción 
Se forman las secuencias X_train y el valor que le sigue y_train:
# creating a data structure with 10 timesteps and 1 output
dataX = []
dataY = []
for i in range(len(test)-time_stemp-1):
    a = test[i:(i+time_stemp), 0]
    dataX.append(a)
    dataY.append(test[i + time_stemp, 0])
testX = numpy.array(dataX)
testY = numpy.array(dataY)
print('testX:',testX.shape[0],',',testX.shape[1],' testY:',testY.shape[0])
print('testX=',testX)
print('testY=',testY)
testX: 60 , 10 testY: 60
testX= [[0.24131274 0.26640925 0.24903473 0.31467178 0.3185328 0.32046333
0.4073359 0.5019305 0.46911195 0.40154442]
...
[0.4980695 0.58108103 0.6042471 0.554054 0.60810804 0.6891892
0.71042466 0.8320464 1. 0.96911204]]
testY= [0.32818535 0.25675675 0.3359073 0.34749034 0.33397684 0.41119692
...
0.6891892 0.71042466 0.8320464 1. 0.96911204 0.7799227 ]
ID:(13892, 0)
Formar los tensores
Descripción 
Para entrenar se debe formar los tensores trainX y testX:
trainX = numpy.reshape(trainX, (trainX.shape[0], 1, trainX.shape[1]))
testX = numpy.reshape(testX, (testX.shape[0], 1, testX.shape[1]))
print('trainX=',trainX)
print('testX=',testX)
trainX= [[[0.01544401 0.02702703 0.05405405 0.04826255 0.03281853 0.05984557
0.08494207 0.08494207 0.06177607 0.02895753]]
...
[[0.18725869 0.19305018 0.16216215 0.25289574 0.23745173 0.25096524
0.3088803 0.38223937 0.36486486 0.2992278 ]]]
testX= [[[0.24131274 0.26640925 0.24903473 0.31467178 0.3185328 0.32046333
0.4073359 0.5019305 0.46911195 0.40154442]]
...
[[0.4980695 0.58108103 0.6042471 0.554054 0.60810804 0.6891892
0.71042466 0.8320464 1. 0.96911204]]]
ID:(13893, 0)
Definir, generar y entrenar el modelo
Descripción 
Definir, generar y entrenar el modelo:
# model
paxs_model = Sequential()
paxs_model.add(LSTM(10, input_shape=(1, time_stemp))) # 10 lstm neuron(block)
paxs_model.add(Dense(1))
paxs_model.compile(loss='mean_squared_error', optimizer='adam')
paxs_model.fit(trainX, trainY, epochs=50, batch_size=1)
Epoch 1/50
60/60 [==============================] - 9s 759us/step - loss: 0.0249
Epoch 2/50
60/60 [==============================] - 0s 710us/step - loss: 0.0041
Epoch 3/50
60/60 [==============================] - 0s 710us/step - loss: 0.0026
...
Epoch 48/50
60/60 [==============================] - 0s 727us/step - loss: 8.7224e-04
Epoch 49/50
60/60 [==============================] - 0s 733us/step - loss: 0.0010
Epoch 50/50
60/60 [==============================] - 0s 724us/step - loss: 0.0012
ID:(13894, 0)
Pronosticar pasajeros
Descripción 
Pronosticar los datos del entrenamiento trainPredict y de los datos de testeo testPredict:
trainPredict = paxs_model.predict(trainX)
testPredict = paxs_model.predict(testX)
# invert predictions
trainPredict = scaler.inverse_transform(trainPredict)
trainY = scaler.inverse_transform([trainY])
testPredict = scaler.inverse_transform(testPredict)
testY = scaler.inverse_transform([testY])
# calculate root mean squared error
trainScore = math.sqrt(mean_squared_error(trainY[0], trainPredict[:,0]))
print('Train Score: %.2f RMSE' % (trainScore))
testScore = math.sqrt(mean_squared_error(testY[0], testPredict[:,0]))
print('Test Score: %.2f RMSE' % (testScore))
ID:(13895, 0)
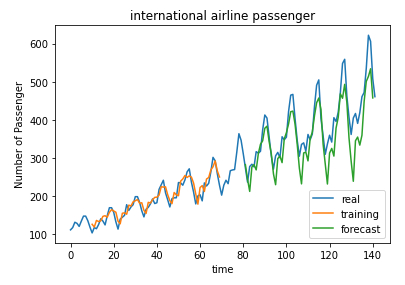
Comparar valores pronosticados con reales
Descripción 
Finalmente se muestran los valores pronosticados y los reales:
# shifting train
trainPredictPlot = numpy.empty_like(dataset)
trainPredictPlot[:, :] = numpy.nan
trainPredictPlot[time_stemp:len(trainPredict)+time_stemp, :] = trainPredict
# shifting test predictions for plotting
testPredictPlot = numpy.empty_like(dataset)
testPredictPlot[:, :] = numpy.nan
testPredictPlot[len(trainPredict)+(time_stemp*2)+1:len(dataset)-1, :] = testPredict
# plot baseline and predictions
plt.plot(scaler.inverse_transform(dataset), label='real')
plt.plot(trainPredictPlot, label='training')
plt.plot(testPredictPlot, label='forecast')
plt.xlabel('time')
plt.ylabel('Number of Passenger')
plt.title('international airline passenger')
plt.legend(loc='lower right')
plt.show()

ID:(13896, 0)
