Series temporales multivariable (LSTM)
Storyboard 
El modelo de parámetros climáticos para pronosticar la evolución de los niveles de contaminación
Código y datos
ID:(1794, 0)
Cargar librerías
Descripción 
Cargar librerías:
from math import sqrt
from numpy import concatenate
from matplotlib import pyplot
from pandas import read_csv
from pandas import DataFrame
from pandas import concat
from sklearn.preprocessing import MinMaxScaler
from sklearn.preprocessing import LabelEncoder
from sklearn.metrics import mean_squared_error
from keras.models import Sequential
from keras.layers import Dense
from keras.layers import LSTM
ID:(13898, 0)
Cargar datos
Descripción 
Cargar datos:
# load dataset
dataset = read_csv('pollution.csv', header=0, index_col=0)
values = dataset.values
print(dataset)
pollution dew temp press wnd_dir wnd_spd snow rain
date
2010-01-02 00:00:00 129.0 -16 -4.0 1020.0 SE 1.79 0 0
2010-01-02 01:00:00 148.0 -15 -4.0 1020.0 SE 2.68 0 0
2010-01-02 02:00:00 159.0 -11 -5.0 1021.0 SE 3.57 0 0
2010-01-02 03:00:00 181.0 -7 -5.0 1022.0 SE 5.36 1 0
2010-01-02 04:00:00 138.0 -7 -5.0 1022.0 SE 6.25 2 0
... ... ... ... ... ... ... ... ...
2014-12-31 19:00:00 8.0 -23 -2.0 1034.0 NW 231.97 0 0
2014-12-31 20:00:00 10.0 -22 -3.0 1034.0 NW 237.78 0 0
2014-12-31 21:00:00 10.0 -22 -3.0 1034.0 NW 242.70 0 0
2014-12-31 22:00:00 8.0 -22 -4.0 1034.0 NW 246.72 0 0
2014-12-31 23:00:00 12.0 -21 -3.0 1034.0 NW 249.85 0 0
[43800 rows x 8 columns]
ID:(13899, 0)
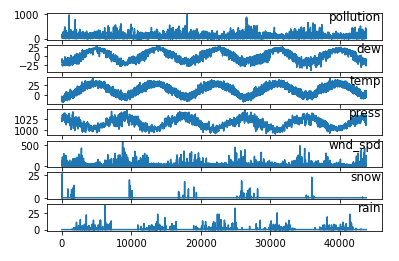
Mostrar datos
Descripción 
Cargar datos:
from matplotlib import pyplot
# specify columns to plot
groups = [0, 1, 2, 3, 5, 6, 7]
i = 1
# plot each column
pyplot.figure()
for group in groups:
    pyplot.subplot(len(groups), 1, i)
    pyplot.plot(values[:, group])
    pyplot.title(dataset.columns[group], y=0.5, loc='right')
    i += 1
pyplot.show()

ID:(13900, 0)
Preparar las series
Descripción 
Preparar las series para entrenar el modelo:
# convert series to supervised learning
def series_to_supervised(data, n_in=1, n_out=1, dropnan=True):
    n_vars = 1 if type(data) is list else data.shape[1]
    df = DataFrame(data)
    cols, names = list(), list()
    # input sequence (t-n, ... t-1)
    for i in range(n_in, 0, -1):
        cols.append(df.shift(i))
        names += [('var%d(t-%d)' % (j+1, i)) for j in range(n_vars)]
    # forecast sequence (t, t+1, ... t+n)
    for i in range(0, n_out):
        cols.append(df.shift(-i))
        if i == 0:
            names += [('var%d(t)' % (j+1)) for j in range(n_vars)]
        else:
            names += [('var%d(t+%d)' % (j+1, i)) for j in range(n_vars)]
    # put it all together
    agg = concat(cols, axis=1)
    agg.columns = names
    # drop rows with NaN values
    if dropnan:
        agg.dropna(inplace=True)
    return agg
ID:(13901, 0)
Encodificar datos
Descripción 
Los datos del viente wnd_dir están en las clases según la dirección o la ausencia de este.
# integer encode direction
encoder = LabelEncoder()
values[:,4] = encoder.fit_transform(values[:,4])
ID:(13902, 0)
Convertir y escalar datos
Descripción 
Los datos son convertidos en números reales mediante la función astype('float32') y luego escalado con la función MinMaxScaler entre 0 y 1.
# ensure all data is float
values = values.astype('float32')
# normalize features
scaler = MinMaxScaler(feature_range=(0, 1))
scaled = scaler.fit_transform(values)
ID:(13903, 0)
Desfasar temporalmente las series
Descripción 
Formar series con desfase temporal:
# specify the number of lag hours
n_hours = 3
n_features = 8
# frame as supervised learning
reframed = series_to_supervised(scaled, n_hours, 1)
print(reframed)
var1(t-3) var2(t-3) var3(t-3) var4(t-3) var5(t-3) var6(t-3) \
3 0.129779 0.352941 0.245902 0.527273 0.666667 0.002290
4 0.148893 0.367647 0.245902 0.527273 0.666667 0.003811
5 0.159960 0.426471 0.229508 0.545454 0.666667 0.005332
6 0.182093 0.485294 0.229508 0.563637 0.666667 0.008391
7 0.138833 0.485294 0.229508 0.563637 0.666667 0.009912
... ... ... ... ... ... ...
43795 0.008048 0.250000 0.311475 0.745455 0.333333 0.365103
43796 0.009054 0.264706 0.295082 0.763638 0.333333 0.377322
43797 0.010060 0.264706 0.278689 0.763638 0.333333 0.385730
43798 0.008048 0.250000 0.278689 0.781818 0.333333 0.395659
43799 0.010060 0.264706 0.262295 0.781818 0.333333 0.405588
var7(t-3) var8(t-3) var1(t-2) var2(t-2) ... var7(t-1) var8(t-1) \
3 0.000000 0.0 0.148893 0.367647 ... 0.000000 0.0
4 0.000000 0.0 0.159960 0.426471 ... 0.037037 0.0
5 0.000000 0.0 0.182093 0.485294 ... 0.074074 0.0
6 0.037037 0.0 0.138833 0.485294 ... 0.111111 0.0
7 0.074074 0.0 0.109658 0.485294 ... 0.148148 0.0
... ... ... ... ... ... ... ...
43795 0.000000 0.0 0.009054 0.264706 ... 0.000000 0.0
43796 0.000000 0.0 0.010060 0.264706 ... 0.000000 0.0
43797 0.000000 0.0 0.008048 0.250000 ... 0.000000 0.0
43798 0.000000 0.0 0.010060 0.264706 ... 0.000000 0.0
43799 0.000000 0.0 0.010060 0.264706 ... 0.000000 0.0
var1(t) var2(t) var3(t) var4(t) var5(t) var6(t) var7(t) \
3 0.182093 0.485294 0.229508 0.563637 0.666667 0.008391 0.037037
4 0.138833 0.485294 0.229508 0.563637 0.666667 0.009912 0.074074
5 0.109658 0.485294 0.213115 0.563637 0.666667 0.011433 0.111111
6 0.105634 0.485294 0.213115 0.581818 0.666667 0.014492 0.148148
7 0.124748 0.485294 0.229508 0.600000 0.666667 0.017551 0.000000
... ... ... ... ... ... ... ...
43795 0.008048 0.250000 0.278689 0.781818 0.333333 0.395659 0.000000
43796 0.010060 0.264706 0.262295 0.781818 0.333333 0.405588 0.000000
43797 0.010060 0.264706 0.262295 0.781818 0.333333 0.413996 0.000000
43798 0.008048 0.264706 0.245902 0.781818 0.333333 0.420866 0.000000
43799 0.012072 0.279412 0.262295 0.781818 0.333333 0.426216 0.000000
var8(t)
3 0.0
4 0.0
5 0.0
6 0.0
7 0.0
... ...
43795 0.0
43796 0.0
43797 0.0
43798 0.0
43799 0.0
[43797 rows x 32 columns]
ID:(13904, 0)
Separar datos en un set de entrenamiento y evaluación
Descripción 
Separar datos en un set para entrenar train y para evaluar test:
# split into train and test sets
values = reframed.values
n_train_hours = 365 * 24
train = values[:n_train_hours, :]
test = values[n_train_hours:, :]
ID:(13905, 0)
Separar datos en ingreso y salida
Descripción 
Separar datos en un set para entrenar train y para evaluar test:
# split into input and outputs
n_obs = n_hours * n_features
train_X, train_y = train[:, :n_obs], train[:, -n_features]
test_X, test_y = test[:, :n_obs], test[:, -n_features]
print(train_X.shape, len(train_X), train_y.shape)
(8760, 24) 8760 (8760,)
ID:(13906, 0)
Resetructurar datos según datos, tiempos y factores
Descripción 
Resetructurar datos según datos, tiempos y factores:
# reshape input to be 3D [samples, timesteps, features]
train_X = train_X.reshape((train_X.shape[0], n_hours, n_features))
test_X = test_X.reshape((test_X.shape[0], n_hours, n_features))
print(train_X.shape, train_y.shape, test_X.shape, test_y.shape)
(8760, 3, 8) (8760,) (35037, 3, 8) (35037,)
ID:(13907, 0)
Definir y configurar el modelo
Descripción 
Definir y configurar el modelo:
# design network
pollution_model = Sequential()
pollution_model.add(LSTM(50, input_shape=(train_X.shape[1], train_X.shape[2])))
pollution_model.add(Dense(1))
pollution_model.compile(loss='mae', optimizer='adam')
ID:(13908, 0)
Entrenar el modelo
Descripción 
Definir y configurar el modelo:
# fit network
history = pollution_model.fit(train_X, train_y, epochs=50, batch_size=72, validation_data=(test_X, test_y), verbose=2, shuffle=False)
Epoch 1/50
122/122 - 3s - loss: 0.0584 - val_loss: 0.0514
Epoch 2/50
122/122 - 1s - loss: 0.0297 - val_loss: 0.0364
Epoch 3/50
122/122 - 1s - loss: 0.0217 - val_loss: 0.0232
...
Epoch 48/50
122/122 - 1s - loss: 0.0141 - val_loss: 0.0144
Epoch 49/50
122/122 - 1s - loss: 0.0145 - val_loss: 0.0140
Epoch 50/50
122/122 - 1s - loss: 0.0143 - val_loss: 0.0136
ID:(13909, 0)
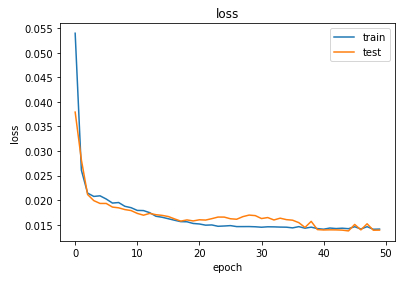
Mostrar función de perdida
Descripción 
Definir y configurar el modelo:
# plot history
pyplot.plot(history.history['loss'], label='train')
pyplot.plot(history.history['val_loss'], label='test')
plt.title('loss')
plt.xlabel('epoch')
plt.ylabel('loss')
pyplot.legend()
pyplot.show()

ID:(13910, 0)
Calcular valores pronosticados
Descripción 
Calcular valores pronosticados:
# make a prediction
yhat = pollution_model.predict(test_X)
test_X = test_X.reshape((test_X.shape[0], n_hours*n_features))
# invert scaling for forecast
inv_yhat = concatenate((yhat, test_X[:, -7:]), axis=1)
inv_yhat = scaler.inverse_transform(inv_yhat)
inv_yhat = inv_yhat[:,0]
# invert scaling for actual
test_y = test_y.reshape((len(test_y), 1))
inv_y = concatenate((test_y, test_X[:, -7:]), axis=1)
inv_y = scaler.inverse_transform(inv_y)
inv_y = inv_y[:,0]
# calculate RMSE
rmse = sqrt(mean_squared_error(inv_y, inv_yhat))
print('Test RMSE: %.3f' % rmse)
Test RMSE: 26.357
ID:(13911, 0)
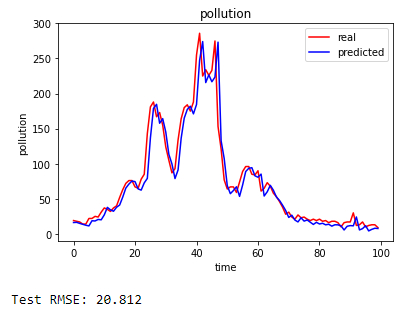
Mostrar valores pronosticados
Descripción 
Mostrar valores pronosticados:
import matplotlib.pyplot as plt
# Visualising the results
sub_y = inv_y[0:100]
sub_yhat = inv_yhat[0:100]
plt.plot(sub_y, color = 'red', label = 'real')
plt.plot(sub_yhat, color = 'blue', label = 'predicted')
plt.title('pollution')
plt.xlabel('time')
plt.ylabel('pollution')
plt.legend()
plt.show()
# calculate RMSE
rmse = sqrt(mean_squared_error(sub_y, sub_yhat))
print('Test RMSE: %.3f' % rmse)

ID:(13912, 0)
