Find modes
Storyboard 
The best way to determine the similarity of temporary segments is to correlate them with the current segment.
To analyze the method, a recent segment that is in the past is taken in order to have a later segment that can be used to evaluate the quality of the forecast.
The correlation is performed of the recent segment with similar segments in the past covering the same seasons. The segment is chosen that has the highest correlation.
ID:(1912, 0)
Reading data from images
Condition 
To obtain the data, all the images must be traversed, reading the corresponding pixels:
import os
from os.path import exists
from PIL import Image

# build date array
sdate = []
year = 2010
month = 6

while year < 2022 or (year == 2022 and month < 6):
    sdate.append(str(year) + \'-\' + str(month).zfill(2))
    if month < 12:
        month = month + 1
    else:
        month = 1
        year = year + 1

# load data (pixels from each image)
num = 0
val = []
for n in range(len(sdate)):

    file_name = \'../NASA/\' + vdir[nm] + \'/\' + vdir[nm] + \'_\' + sdate[n] + \'.PNG\'n    if exists(file_name):

        im_var = Image.open(file_name)
        # if needed resize
        var_width, var_height = im_var.size
        if var_width != width or var_height != height:
            im_resize = im_var.resize((width, height),resample=Image.NEAREST)
            im_var = im_resize

        pix_var = im_var.load()

        if pix_var[i,j] < 255:
            val.append(min_var[nm] + (max_var[nm] - min_var[nm])*pix_var[i,j]/254)
        else:
            val.append(9999)
        num = num + 1

if 144 != num:
    print(\'Number or records:\',num)
    sys.exit()
ID:(14332, 0)
Missing data problem
Condition 
To supply missing data (with values 9999 or -9999) we proceed to interpolate the values. In case they are at the extremes, it is interpolated from the mean value of the scale:
# Eliminate missing values
x = []
min_range = []
max_range = []
cnt_range = []
delta_range = []
val_range = []
sta = 0
for i in range(len(val)):
    # case first point unknown
    if i == 0 and (val[0] == 9999 or val[0] == -9999):
        min_range.append(0)
        cnt_range.append(1)
        sta = 1
    # no case selected
    if sta == 0:
        # check if range is starting and setup in case
        if val[i] == 9999 or val[i] == -9999:
            min_range.append(i)
            cnt_range.append(1)
            sta = 1
    # case in progress
    else:
        # is finishing
        if val[i] != 9999 and val[i] != -9999:
            max_range.append(i-1)
            delta_range.append(0)
            val_range.append(0)
            sta = 0
        # not finish
        else:
            cnt_range[len(cnt_range)-1] = cnt_range[len(cnt_range)-1] + 1
    x.append(val[i])

# close if case in progress
if sta == 1:
    max_range.append(len(val)-1)
    delta_range.append(0)
    val_range.append(0)

# setup delta and val
for i in range(len(cnt_range)):

    # if last point
    if max_range[i] == len(x) - 1:
        delta_range[i] = (max_var[nm] + min_var[nm])/2
    else:
        delta_range[i] = x[max_range[i] + 1]
    print(\'max\',max_range[i],x[max_range[i] + 1])

    # if first point
    if min_range[i] == 0:
        delta_range[i] = delta_range[i] - (max_var[nm] + min_var[nm])/2
        val_range[i] = (max_var[nm] + min_var[nm])/2
    else:
        delta_range[i] = delta_range[i] - x[min_range[i] - 1]
        val_range[i] = x[min_range[i] - 1]
    print(\'min\',min_range[i],x[min_range[i] - 1])

    for n in range(min_range[i],max_range[i] + 1):
        x[n] = val_range[i] + delta_range[i]*(n - min_range[i] + 1)/(max_range[i] - min_range[i] + 2)
ID:(14319, 0)
Calculation of the trend by regression
Condition 
To obtain the trend within the signal, we perform a regression with all the time points with which it is modeled:
# Seteo de datos
sxy = 0
sx = 0
sy = 0
sx2 = 0
N = 0

# calculo de sumas
for i in range(x):

    # sumas
    sxy = sxy + i*x[i]
    sx = sx + i
    sy = sy + x[i]
    sx2 = sx2 + i**2
    N = N + 1

# calculate coefficients
d = N*sx2 - sx**2
if d != 0:
    a = (sx2*sy - sx*sxy)/d1
    b = (N*sxy - sx*sy)/d1
ID:(14317, 0)
Prepare the time series
Image 
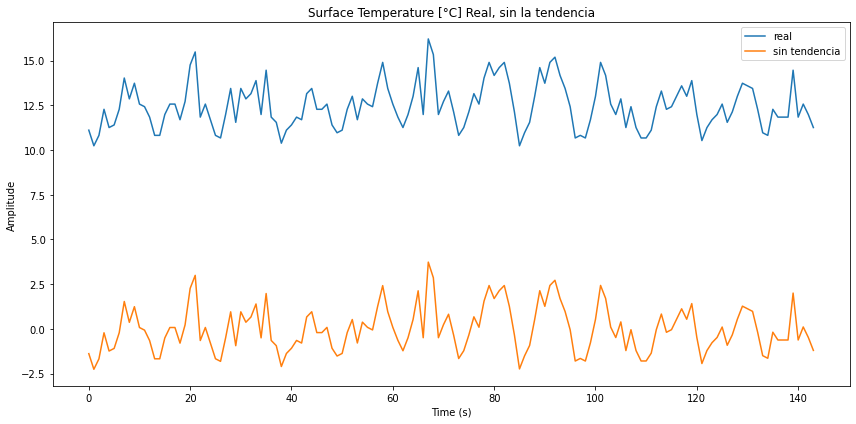
Para obtener los modos se debe primero restar la tendencia. Esto se logra restando la función obtenida de la regresión:
z = []
for i in range(len(x)):
    z.append(x[i] - a - b*i)
Con ello se obtiene una nueva función que oscila en torno de cero:
ID:(14318, 0)
Calculation of modes
Image 
Los modos se obtienen realizando la transformada de Fourier:
import numpy np
from numpy.fft import fft, ifft

Z = fft(z)
T = len(Z)
t = np.arange(N)
df = 1/T
con lo que se obtiene un diagrama en que se ve cada modo:
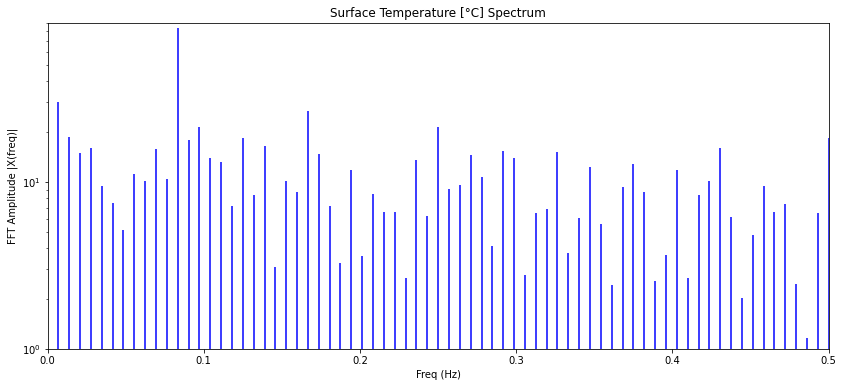
Nota: las lineas corresponde a valores complejos. La representación es en función del valor absoluto:
import matplotlib.pyplot as plt

plt.figure(figsize = (14, 6))
plt.stem(freq, np.abs(Z), \'b\', markerfmt=\' \', basefmt=\'-b\')
plt.title(unt_var[nm]+\' Spectrum\')
plt.xlabel(\'Freq (Hz)\')
plt.ylabel(\'FFT Amplitude |X(freq)|\')
plt.yscale(\'log\')
plt.xlim(0,0.5)
plt.show()
ID:(14333, 0)
Annual mode filtering
Image 
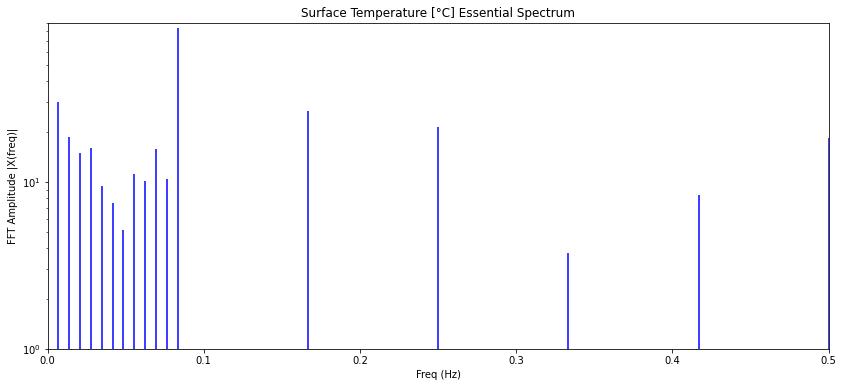
El espectro esta compuesto de tres partes:
- la oscilación anual
- los modos de periodo mayor que un año
- las fluctuaciones
Los primeros son la onda base con frecuencia de 1/12 y sus armónicos. Las frecuencias menores debajo de la frecuencia base y los modos entre los armónicos que corresponden a las fluctuaciones. Para obtener el modelo se eliminan las fluctuaciones lo que se logra simplemente anulando los valores del espectro:
Zm = []

for i in range(len(Z)):
    if i < imax:
        # frecuencias bajas
        Zm.append(Z[i])
    elif i % imax == 0:
        # modos anuales
        Zm.append(Z[i])
    else:
        # frecuencias altas
        Zm.append(complex(0,0))
con lo que se obtiene un diagrama en que se ve cada modo:
ID:(14335, 0)
Annual model modes
Image 
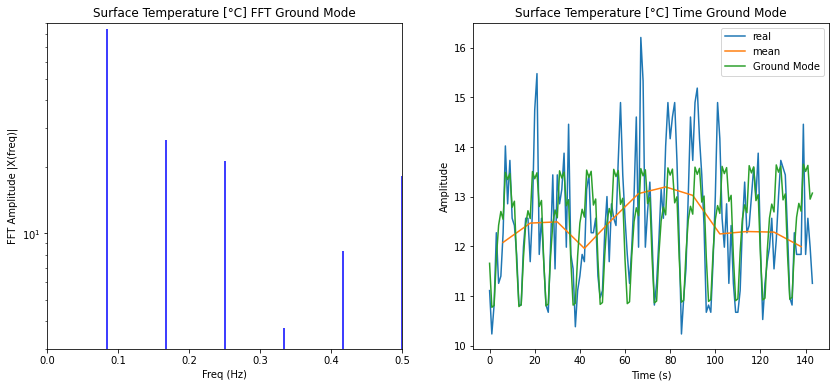
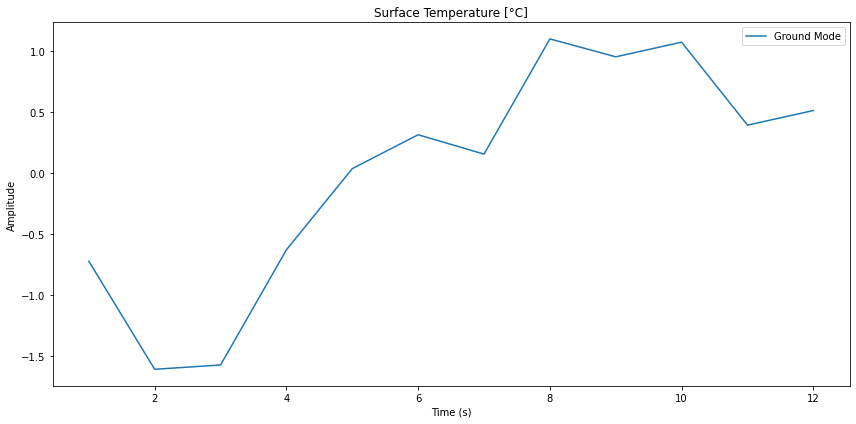
Si se consideran solo los modos anuales se puede filtrar aquella parte de la serie temporal:
ID:(14334, 0)
Annual model time series
Image 
Si se calcula la transformada de Fourier inversa se puede obtener la forma de la curva para estos modos.
from numpy.fft import fft, ifft

X = ifft(Z)
En este caso se obtiene una serie temporal de la forma:
ID:(14338, 0)
Modes of the lower frequency model
Image 
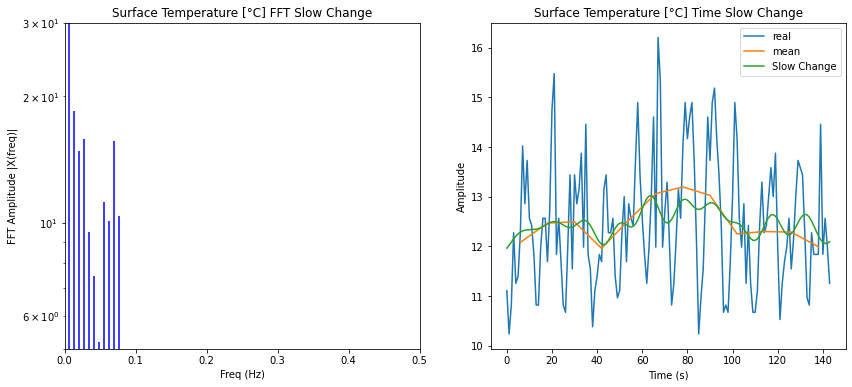
Si se consideran solo los modos de frecuencias menores, se puede filtrar aquella parte de la serie temporal:
ID:(14336, 0)
Minor frequency model time serie
Image 
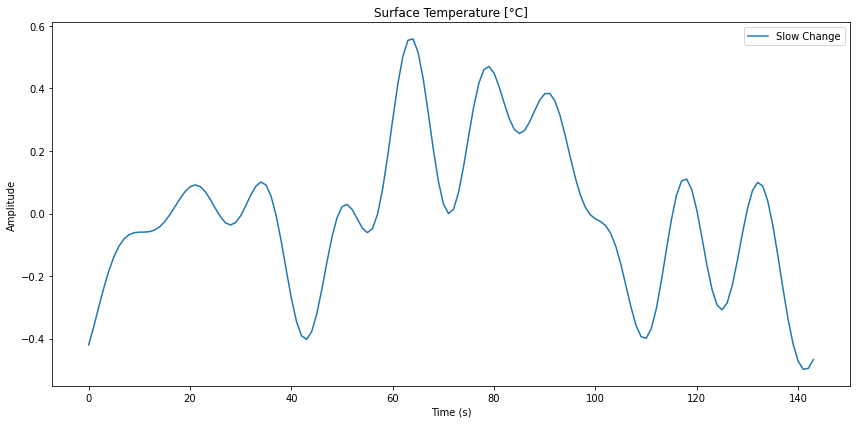
Si se calcula la transformada de Fourier inversa se puede obtener la forma de la curva para estos modos.
from numpy.fft import fft, ifft

X = ifft(Z)
En este caso se obtiene una serie temporal de la forma:
ID:(14340, 0)
Fluctuation model modes
Image 
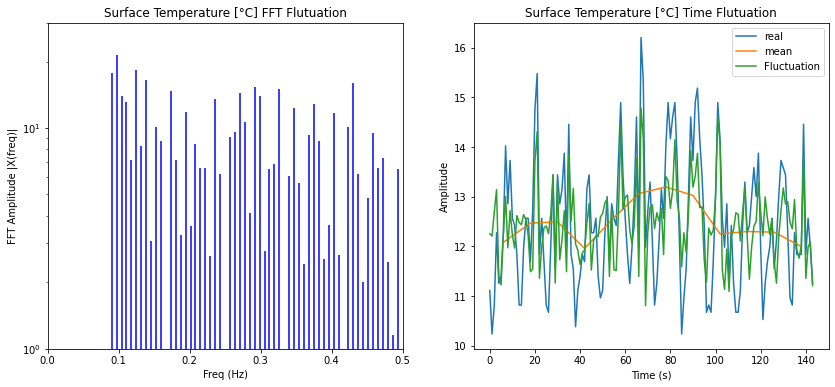
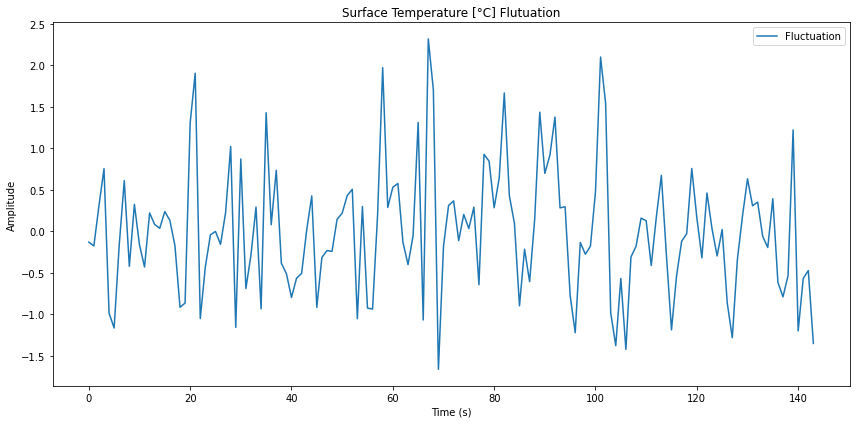
Si se consideran solo los modos de fluctuación se puede filtrar aquella parte de la serie temporal:
ID:(14337, 0)
Fluctuations model time series
Image 
Si se calcula la transformada de Fourier inversa se puede obtener la forma de la curva para estos modos.
from numpy.fft import fft, ifft

X = ifft(Z)
En este caso se obtiene una serie temporal de la forma:
ID:(14339, 0)
Fluctuation analysis
Image 
To determine if the fluctuation has some type of structure, segments of fluctuations between different years can be correlated:
import numpy as np
import pandas as pd
import matplotlib.pyplot as plt
import seaborn as sns

data = {}
col = []
for i in range(0,nmon):
    temp = []
    for s in range(0,12):
        temp.append(Xf[12*i + s])
    data[str(i+1)] = temp
    col.append(str(i+1))

df = pd.DataFrame(data,columns=col)

dfcorr = df.corr().round(2)

plt.figure(figsize = (12, 12))
plt.title(\'Correlation\')
mask = np.triu(np.ones_like(dfcorr, dtype=bool))
sns.heatmap(dfcorr, annot=True, vmax=1, vmin=-1, center=0, cmap=\'vlag\', mask=mask)
plt.show()
The output shows all possible correlations:
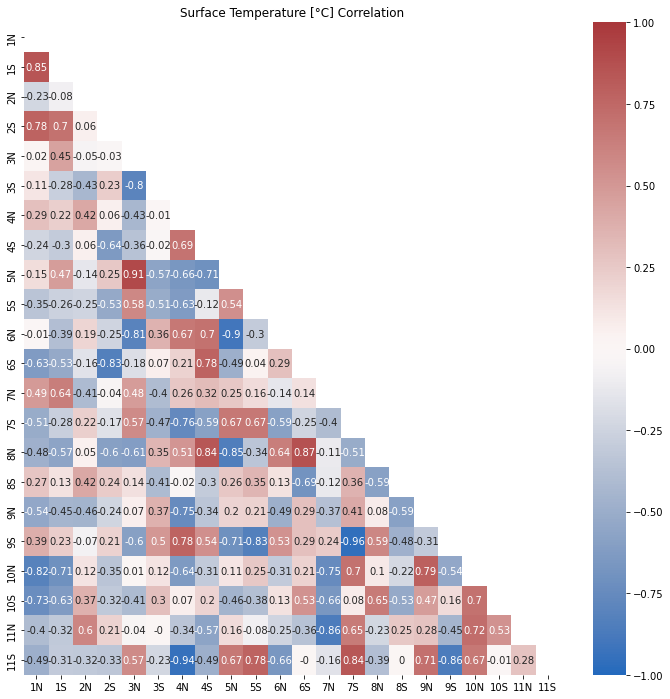
which in this case do not seem to show a characteristic repetitive pattern.
ID:(14341, 0)
