Concept
Storyboard 
Weather patterns can be assumed to repeat themselves over time. In that case it is possible to locate, for any location, a similar sequence in the past.
If it is assumed that the climatic pattern is slowly migrating, it can be concluded that the segment that follows the segment found will have some degree of similarity with the continuation of the current climatic pattern.
In this way, it is possible to infer how the climate will behave in the coming months based on what has happened in the last time and historical data to search for a similar period.
ID:(1911, 0)
Forecast with modes
Image 
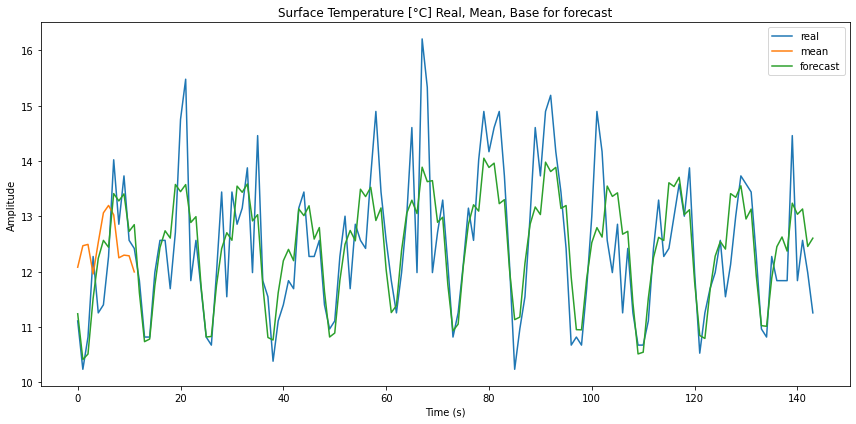
With mode analysis you can reconstruct the time series and forecast its future:
- estimating the trend,
- estimating and summing the smooth oscillations and
- estimating and adding the annual oscillations
What we cannot estimate and constitutes a forecast error is the part of the fluctuations. In this way the result is a curve that largely follows the general shape but differs on a smaller scale:
ID:(14331, 0)
Fluctuations
Image 
Climate time series generally have high-frequency fluctuations (period of days) that correspond to meteorological phenomena, particularly related to atmospheric turbulence. If they are extracted they have the form as follows:
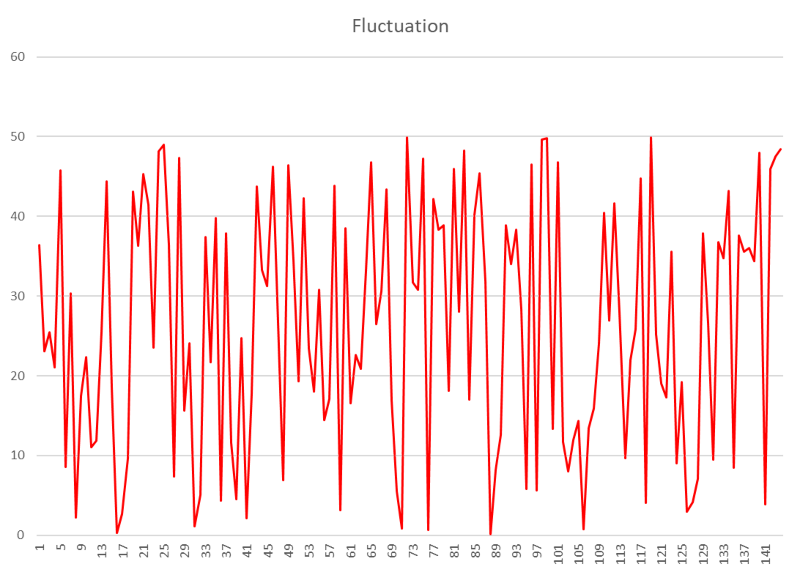
in which a particular structure is not recognized.
ID:(14320, 0)
Climatic series without fluctuations
Image 
If the high-frequency components are filtered, we end up with a time series that maintains certain periodicity but with a more harmonic appearance:
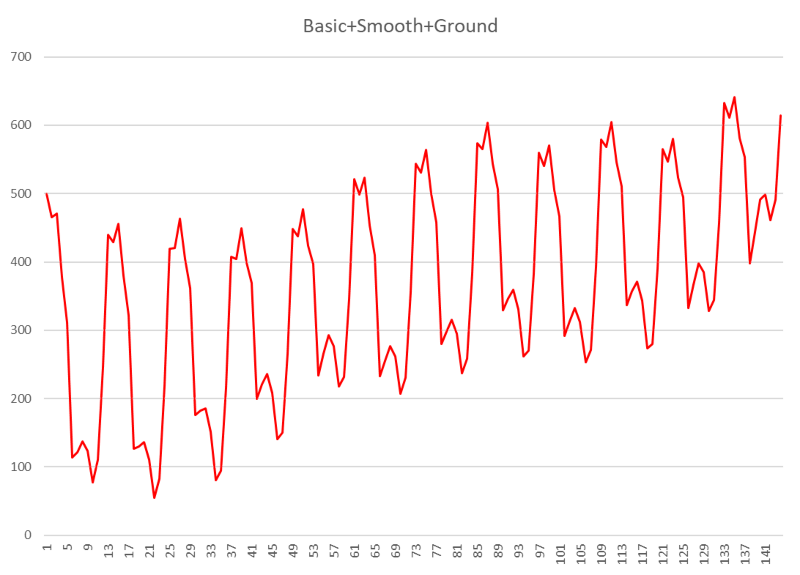
The basis of this series is a characteristic fluctuation that seems to repeat itself regularly. It corresponds to what is the annual fluctuation of the series that comes from the rotation of the earth around the sun.
ID:(14322, 0)
Climatic parameter
Image 
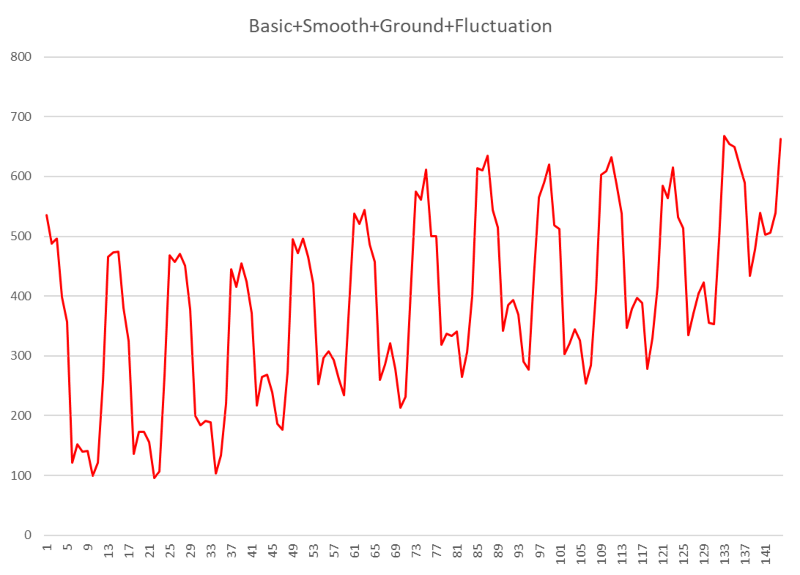
The climate is described by a set of parameters measured on the surface of the planet with a defined periodicity.
If a particular location is taken, the evolution of the parameter over time can be studied. Thus, a time series is obtained:
ID:(14321, 0)
Annual fluctuations
Image 
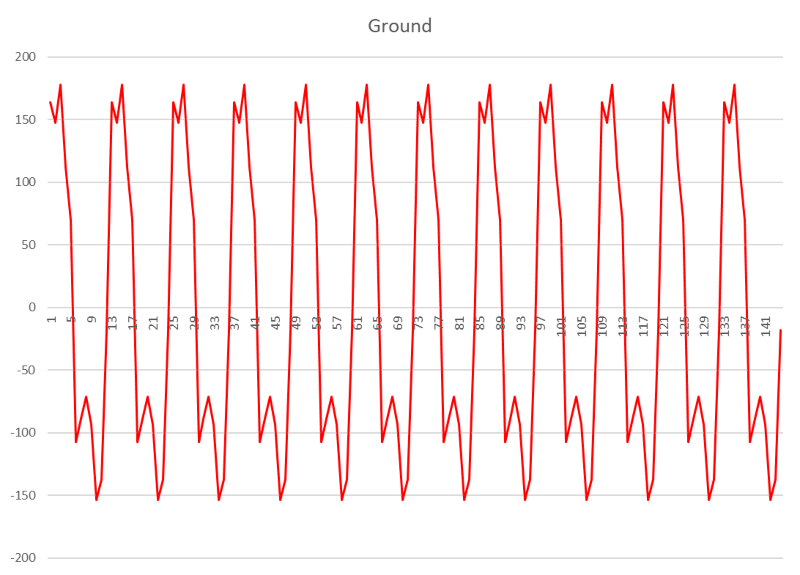
The annual component presents the periodicity of the 12 months in which the same curve is repeated over and over again:
ID:(14323, 0)
Shape of the annual oscillation
Image 
The annual section can be extracted and observed without its sequence:
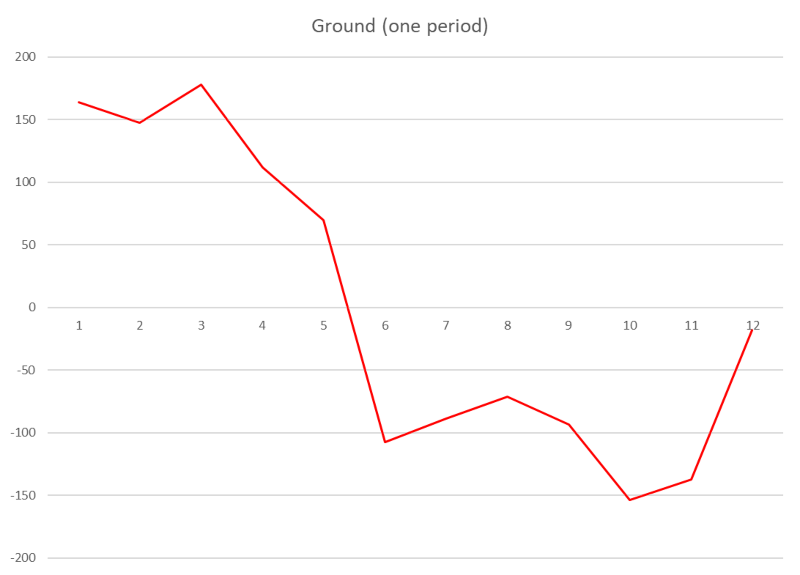
In this case, an increase is observed around the first few months, which is typical of phenomena in the southern hemisphere. Similarly, curves centered on the middle of the year are observed in the northern hemisphere.
ID:(14324, 0)
Climatic series without annual oscillations
Image 
If the components of annual oscillations are filtered, we end up with a time series that maintains a smooth oscillation plus a trend:
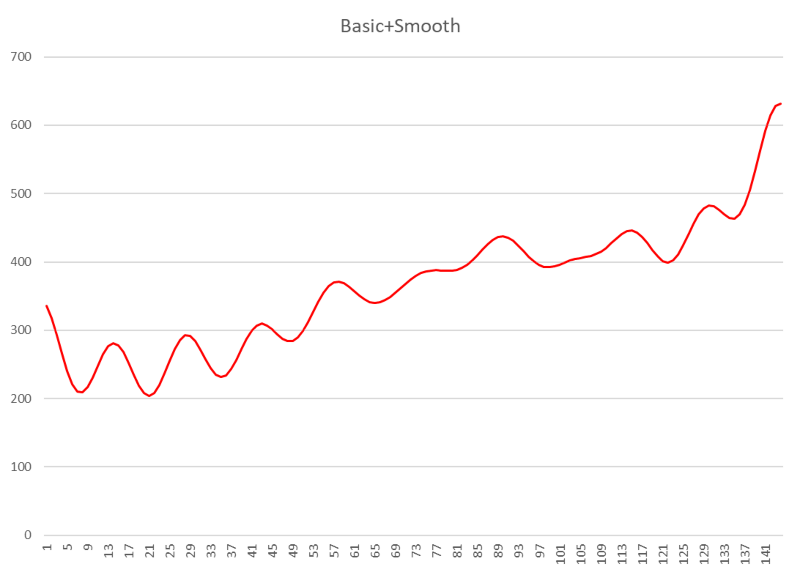
The smooth oscillation corresponds to phenomena with periods of several years, such as the oscillations of the South Pacific (period of 1 to 3 years of the El Niño and La Niña phenomenon) and sunspots (period of 10 to 12 years).
ID:(14325, 0)
Smooth oscillations climatic series
Image 
If the part of the smooth oscillations is removed, the phenomena of periods of several years can be better seen:
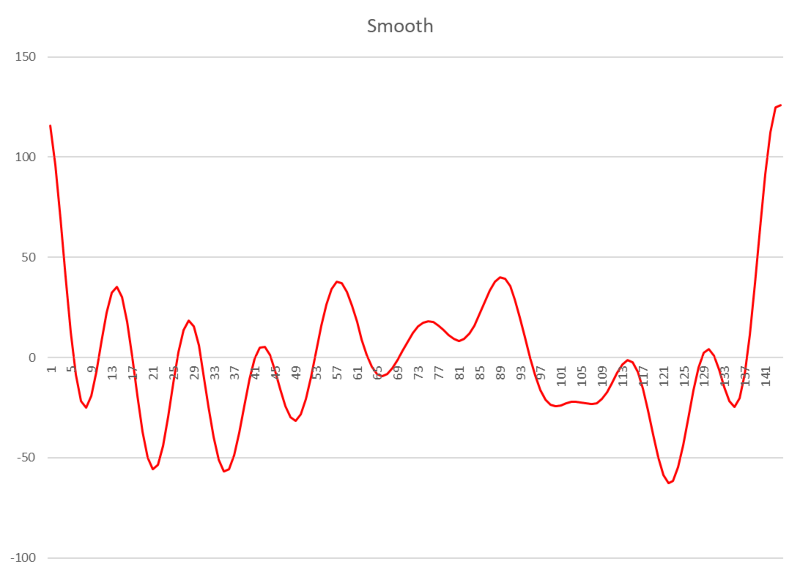
From this type of curve it is possible to detect to what extent, for example, the phenomena of the boy and/or the girl affect and in what way.
ID:(14326, 0)
South pacific oscillations
Image 
One of the oscillations with periods of several years is the so-called South Pacific oscillation, which gives rise to the El Niño and La Niña phenomena. The oscillation has existed for thousands of years and has been monitored for many years as the following image shows:

ID:(14327, 0)
Sunspots
Image 
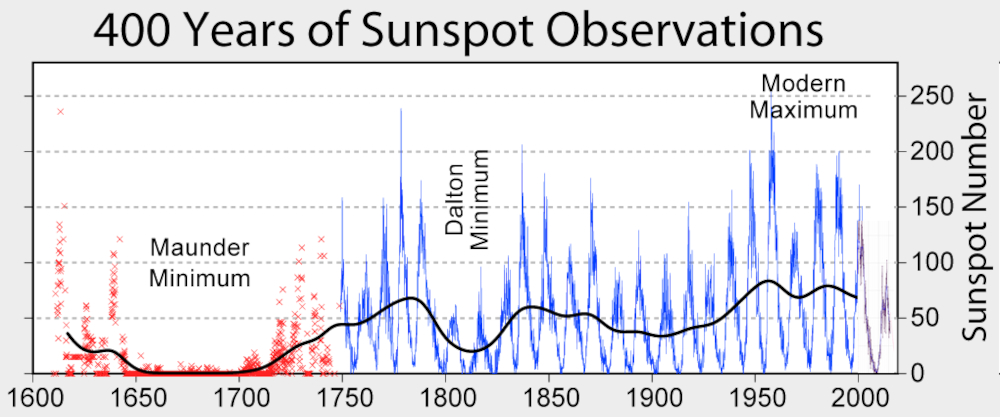
One of the oscillations with periods of several years are called sunspots. These increase every 10 to 12 and mean an increase in solar radiation which affects the climate. The oscillations have existed for thousands of years and have been monitored for a long time, giving curves as the curves show:
ID:(14328, 0)
Climate trends
Image 
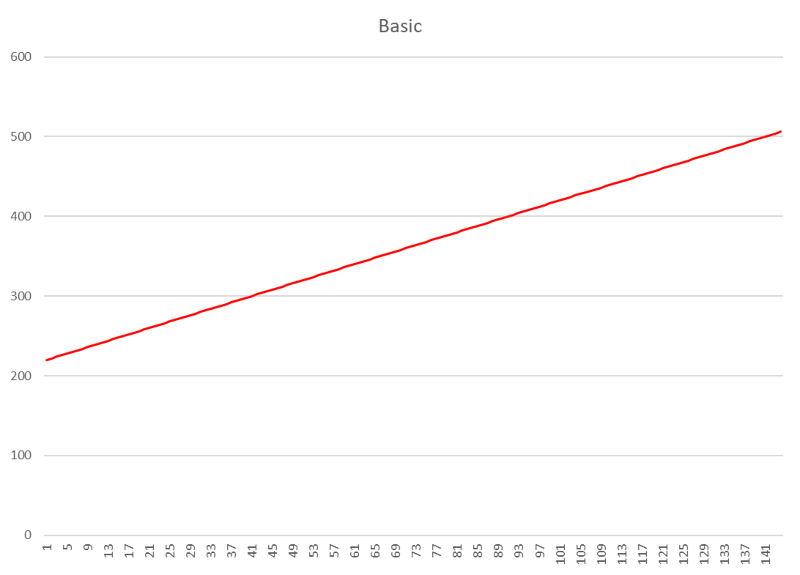
If all the oscillations are extracted, the climatic series are reduced to the trends that are generally associated with climate change:
ID:(14329, 0)
Increase in carbon dioxide
Image 
The increase in carbon dioxide has given rise to the so-called Keeling curve in honor of Charles Keeling who began measuring CO2 at the Mauna Loa Observatory in Hawaii in 1958:
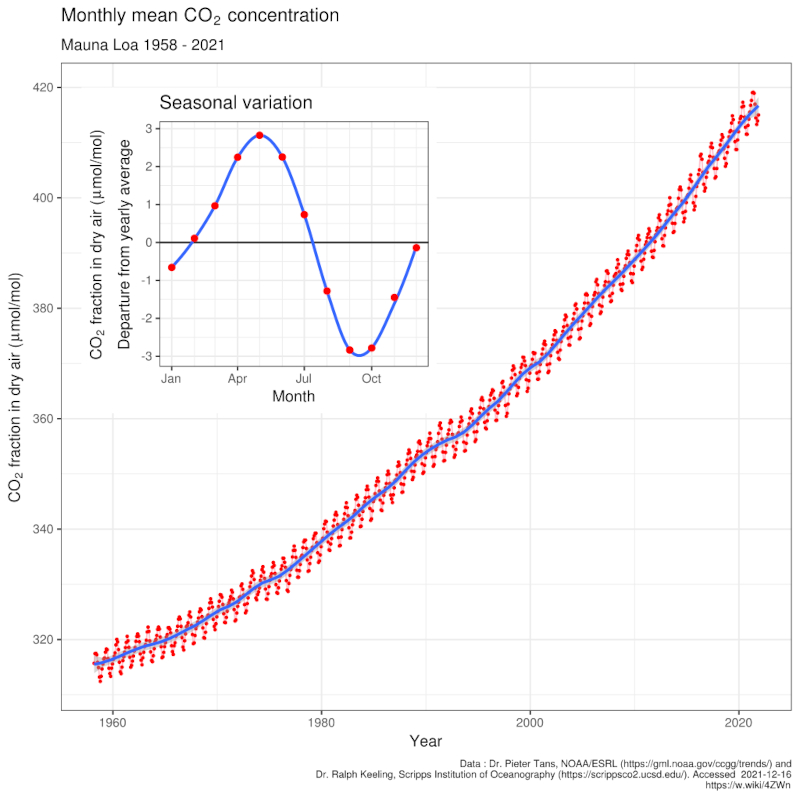
Carbon dioxide in the atmosphere is one of the causes of warming. This effect is visualized in a series of other climatic parameters that are shown in the trends.
ID:(14330, 0)
