Long Short Term Memory (LSTMs)
Storyboard 
The passenger number model takes historical segments and the value that follows them and seeks to recognize the pattern and after any sequence infer how it will continue.
Code and data
international-airline-passengers.csv
ID:(1793, 0)
Import libraries
Description 
Import the necessary libraries:
import numpy
import pandas as pd
import matplotlib.pyplot as plt
import math
from keras.models import Sequential
from keras.layers import Dense
from keras.layers import LSTM
from sklearn.preprocessing import MinMaxScaler
from sklearn.metrics import mean_squared_error
ID:(13885, 0)
Load historical data
Description 
Load the data from the international-airline-passengers.csv data:
# load data
data = pd.read_csv('international-airline-passengers.csv',skipfooter=5)
data.head()

ID:(13886, 0)
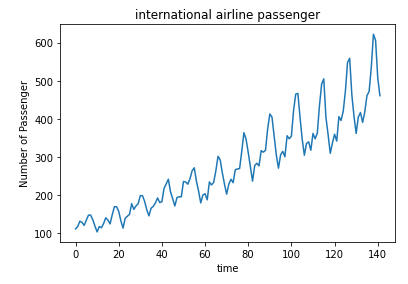
Show the historical data
Description 
Show the data:
# show data
dataset = data.iloc[:,1].values
plt.plot(dataset)
plt.xlabel('time')
plt.ylabel('Number of Passenger')
plt.title('international airline passenger')
plt.show()

ID:(13887, 0)
Reshape and list data
Description 
Reshape and list data:
# reshape and list data
dataset = dataset.reshape(-1,1)
dataset = dataset.astype('float32')
print(dataset)
[[112.]
[118.]
[132.]
[129.]
...
[606.]
[508.]
[461.]]
ID:(13888, 0)
Rescale values
Description 
To improve the quality of learning, the values between 0 and 1 are re-scaled:
# scaling
scaler = MinMaxScaler(feature_range=(0, 1))
dataset = scaler.fit_transform(dataset)
print(dataset)
[[0.01544401]
[0.02702703]
[0.05405405]
...
[0.96911204]
[0.7799227 ]
[0.6891892 ]]
ID:(13889, 0)
Generar los datos de entrenamiento y evaluation
Description 
El arreglo inicial es segmentado en un grupo de registros para entrenar y un segundo para testear el modelo generado:
# generate train and test data
train_size = int(len(dataset) * 0.50)
test_size = len(dataset) - train_size
train = dataset[0:train_size,:]
test = dataset[train_size:len(dataset),:]
print('train size: {}, test size: {} '.format(len(train), len(test)))
print(train)
train size: 71, test size: 71
[[0.01544401]
[0.02702703]
[0.05405405]
...
[0.2992278 ]
[0.24131274]
[0.1911197 ]]
ID:(13890, 0)
Create training segments
Description 
The sequences X_train and the value that follows y_train are formed:
# creating a data structure with 10 timesteps and 1 output
time_stemp = 10
dataX = []
dataY = []
for i in range(len(train)-time_stemp-1):
    a = train[i:(i+time_stemp), 0]
    dataX.append(a)
    dataY.append(train[i + time_stemp, 0])
trainX = numpy.array(dataX)
trainY = numpy.array(dataY)
print('trainX:',trainX.shape[0],',',trainX.shape[1],' trainY:',trainY.shape[0])
print('trainX=',trainX)
print('trainY=',trainY)
trainX: 60 , 10 trainY: 60
trainX= [[0.01544401 0.02702703 0.05405405 0.04826255 0.03281853 0.05984557
0.08494207 0.08494207 0.06177607 0.02895753]
...
[0.18725869 0.19305018 0.16216215 0.25289574 0.23745173 0.25096524
0.3088803 0.38223937 0.36486486 0.2992278 ]]
trainY= [0. 0.02702703 0.02123553 0.04247104 0.07142857 0.05984557
...
0.25096524 0.3088803 0.38223937 0.36486486 0.2992278 0.24131274]
ID:(13891, 0)
Create assessment segments
Description 
The sequences X_train and the value that follows y_train are formed:
# creating a data structure with 10 timesteps and 1 output
dataX = []
dataY = []
for i in range(len(test)-time_stemp-1):
    a = test[i:(i+time_stemp), 0]
    dataX.append(a)
    dataY.append(test[i + time_stemp, 0])
testX = numpy.array(dataX)
testY = numpy.array(dataY)
print('testX:',testX.shape[0],',',testX.shape[1],' testY:',testY.shape[0])
print('testX=',testX)
print('testY=',testY)
testX: 60 , 10 testY: 60
testX= [[0.24131274 0.26640925 0.24903473 0.31467178 0.3185328 0.32046333
0.4073359 0.5019305 0.46911195 0.40154442]
...
[0.4980695 0.58108103 0.6042471 0.554054 0.60810804 0.6891892
0.71042466 0.8320464 1. 0.96911204]]
testY= [0.32818535 0.25675675 0.3359073 0.34749034 0.33397684 0.41119692
...
0.6891892 0.71042466 0.8320464 1. 0.96911204 0.7799227 ]
ID:(13892, 0)
Form the tensioners
Description 
To train, the tensors trainX and testX must be formed:
trainX = numpy.reshape(trainX, (trainX.shape[0], 1, trainX.shape[1]))
testX = numpy.reshape(testX, (testX.shape[0], 1, testX.shape[1]))
print('trainX=',trainX)
print('testX=',testX)
trainX= [[[0.01544401 0.02702703 0.05405405 0.04826255 0.03281853 0.05984557
0.08494207 0.08494207 0.06177607 0.02895753]]
...
[[0.18725869 0.19305018 0.16216215 0.25289574 0.23745173 0.25096524
0.3088803 0.38223937 0.36486486 0.2992278 ]]]
testX= [[[0.24131274 0.26640925 0.24903473 0.31467178 0.3185328 0.32046333
0.4073359 0.5019305 0.46911195 0.40154442]]
...
[[0.4980695 0.58108103 0.6042471 0.554054 0.60810804 0.6891892
0.71042466 0.8320464 1. 0.96911204]]]
ID:(13893, 0)
Define, build, and train the model
Description 
Define, build, and train the model:
# model
paxs_model = Sequential()
paxs_model.add(LSTM(10, input_shape=(1, time_stemp))) # 10 lstm neuron(block)
paxs_model.add(Dense(1))
paxs_model.compile(loss='mean_squared_error', optimizer='adam')
paxs_model.fit(trainX, trainY, epochs=50, batch_size=1)
Epoch 1/50
60/60 [==============================] - 9s 759us/step - loss: 0.0249
Epoch 2/50
60/60 [==============================] - 0s 710us/step - loss: 0.0041
Epoch 3/50
60/60 [==============================] - 0s 710us/step - loss: 0.0026
...
Epoch 48/50
60/60 [==============================] - 0s 727us/step - loss: 8.7224e-04
Epoch 49/50
60/60 [==============================] - 0s 733us/step - loss: 0.0010
Epoch 50/50
60/60 [==============================] - 0s 724us/step - loss: 0.0012
ID:(13894, 0)
Forecast passangers
Description 
Predict training data trainPredict and test data testPredict :
trainPredict = paxs_model.predict(trainX)
testPredict = paxs_model.predict(testX)
# invert predictions
trainPredict = scaler.inverse_transform(trainPredict)
trainY = scaler.inverse_transform([trainY])
testPredict = scaler.inverse_transform(testPredict)
testY = scaler.inverse_transform([testY])
# calculate root mean squared error
trainScore = math.sqrt(mean_squared_error(trainY[0], trainPredict[:,0]))
print('Train Score: %.2f RMSE' % (trainScore))
testScore = math.sqrt(mean_squared_error(testY[0], testPredict[:,0]))
print('Test Score: %.2f RMSE' % (testScore))
ID:(13895, 0)
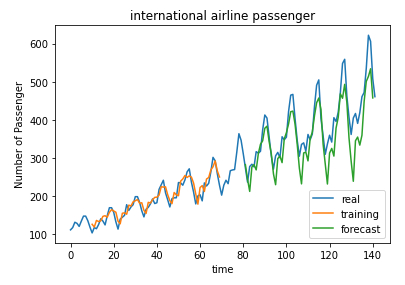
Compare Predicted Values With Actuals
Description 
Finally, the predicted and actual values are displayed:
# shifting train
trainPredictPlot = numpy.empty_like(dataset)
trainPredictPlot[:, :] = numpy.nan
trainPredictPlot[time_stemp:len(trainPredict)+time_stemp, :] = trainPredict
# shifting test predictions for plotting
testPredictPlot = numpy.empty_like(dataset)
testPredictPlot[:, :] = numpy.nan
testPredictPlot[len(trainPredict)+(time_stemp*2)+1:len(dataset)-1, :] = testPredict
# plot baseline and predictions
plt.plot(scaler.inverse_transform(dataset), label='real')
plt.plot(trainPredictPlot, label='training')
plt.plot(testPredictPlot, label='forecast')
plt.xlabel('time')
plt.ylabel('Number of Passenger')
plt.title('international airline passenger')
plt.legend(loc='lower right')
plt.show()

ID:(13896, 0)
