Datos Mosquitos
Description 
Algunos de los mosquitos son el Aedes Aegypti y el Culex. El primero transmite entre otras la fiebre amarilla, chikungunya, fiebre del dengue y el virus Zika. El segundo es responsable de transmitir el virus del Nilo Occidental, la filariasis, la encefalitis japonesa, encefalitis de San Luis y la malaria aviar.
Algunos datos (Simulation Modelling of Population Dynamics of Mosquito Vectors for Rift Valley Fever Virus in a Disease Epidemic Setting Clement N. Mweya , Niels Holst, Leonard E. G. Mboera, Sharadhuli I. Kimera Plos OnePublished: September 26, 2014http://dx.doi.org/10.1371/journal.pone.0108430) son:
Parámetro | Aedes Aegypti | Culex
---------------|---------------------|---------
Longevidad [dias] | 30.0-45.8 | 25.2-36.9
Huevos por hembra y día | 25-35 | 21-69
Eclosión de Huevos | 85-95% | 75.2-89.0%
Sobrevivencia de Larvas | 90-100% | 47.8-68.5%
Proporción mosquitos hembra | 50% | 50%
ID:(8198, 0)
Presencia de Malaria en Paises
Description 
La malaria esta presente en 95 países con un total de casi 78 millones de casos confirmados (WHO). A continuación se presenta la lista de países con 0.01% o más, donde primero se lista el número de casos (WHO 2014), la población (Wikipedia, datos de 2010 a 2015) y luego la fracción de la población.
País | Casos | Población | Fración
-------|---------:|--------------:|-----------:
Afganistan | 61362 | 27657145 | 0.22%
Angola | 2298979 | 25868000 | 8.89%
Bangladesh | 10216 | 160879586 | 0.01%
Belize | 19 | 370300 | 0.01%
Benin | 1044235 | 10653654 | 9.80%
Brasil | 143415 | 206036761 | 0.07%
Bolivia | 7401 | 10985059 | 0.07%
Botswana | 1346 | 2141206 | 0.06%
Burkina Faso | 5428655 | 19034397 | 28.52%
Burundi | 4585273 | 10114505 | 45.33%
Cambodia | 25152 | 15626444 | 0.16%
Central African Republic | 295088 | 4998000 | 5.90%
Chad | 914032 | 14497000 | 6.30%
Colombia | 40768 | 48727882 | 0.08%
Congo | 66323 | 4741000 | 1.40%
Comoros | 2203 | 806153 | 0.27%
Cote d'Ivoire | 3712831 | 22671331 | 16.38%
Democratic Republic of the Congo | 9968983 | 85026000 | 11.72%
Equatorial Guinea | 20417 | 1222442 | 1.67%
Eritrea | 30768 | 5352000 | 0.57%
Etiopia | 2118815 | 92206005 | 2.30%
Ghana | 3415912 | 27670174 | 12.35%
Guatemala | 4931 | 16176133 | 0.03%
Guinea | 660207 | 12947000 | 5.10%
Guinea-Bissau | 93431 | 1547777 | 6.04%
Guyana | 12354 | 746900 | 1.65%
Haiti | 17662 | 11078033 | 0.16%
Honduras | 3380 | 8576532 | 0.04%
India | 1102205 | 1285758969 | 0.09%
Indonesia | 252027 | 258705000 | 0.10%
Kenya | 2808931 | 47251000 | 5.94%
Laos | 48071 | 6472400 | 0.74%
Liberia | 864204 | 4615000 | 18.73%
Madagascar | 365239 | 22434363 | 1.63%
Malawi | 2905310 | 16832910 | 17.26%
Malaysia | 3147 | 31381568 | 0.01%
Mali | 2039853 | 18135000 | 11.25%
Mauritania | 15835 | 3718678 | 0.43%
Mozambique | 7117648 | 26423700 | 26.94%
Myanmar | 152195 | 51419420 | 0.30%
Namibia | 15914 | 2324388 | 0.68%
Nepal | 1469 | 28431500 | 0.01%
Nicaragua | 1163 | 6262703 | 0.02%
Niger | 1953309 | 20715000 | 9.43%
Nigeria | 7926954 | 186988000 | 4.24%
Pakistan | 275149 | 193922354 | 0.14%
Panama | 874 | 3814672 | 0.02%
Papua New Guinea | 281182 | 8083700 | 3.48%
Peru | 64676 | 31488700 | 0.21%
Rwanda | 1610812 | 11553188 | 13.94%
Sao Tome and Prince | 1754 | 187356 | 0.94%
Senegal | 265624 | 14799859 | 1.79%
Sierra Leone | 1374476 | 7075641 | 19.43%
Solomon Islands | 18404 | 642000 | 2.87%
Somalia | 11001 | 11079000 | 0.10%
South Africa | 11705 | 54956900 | 0.02%
Sudan | 1068506 | 39598700 | 2.70%
Suriname | 374 | 541638 | 0.07%
Swaziland | 269 | 1132657 | 0.02%
Thailand | 37921 | 65314496 | 0.06%
Togo | 1130251 | 7143000 | 15.82%
Uganda | 3631939 | 33860700 | 10.73%
Tanzania | 680807 | 55155000 | 1.23%
Timor Leste | 342 | 1167242 | 0.03%
Vanuatu | 982 | 277500 | 0.35%
Venezuela | 90708 | 31028700 | 0.29%
Viet Nam | 15752 | 91700000 | 0.02%
Yemen | 67513 | 27478000 | 0.25%
Zambia | 4077547 | 15933883 | 25.59%
Zimbabwe | 535931 | 14240168 | 3.76%
ID:(8197, 0)
Statistics of mosquito and bite populations
Image 
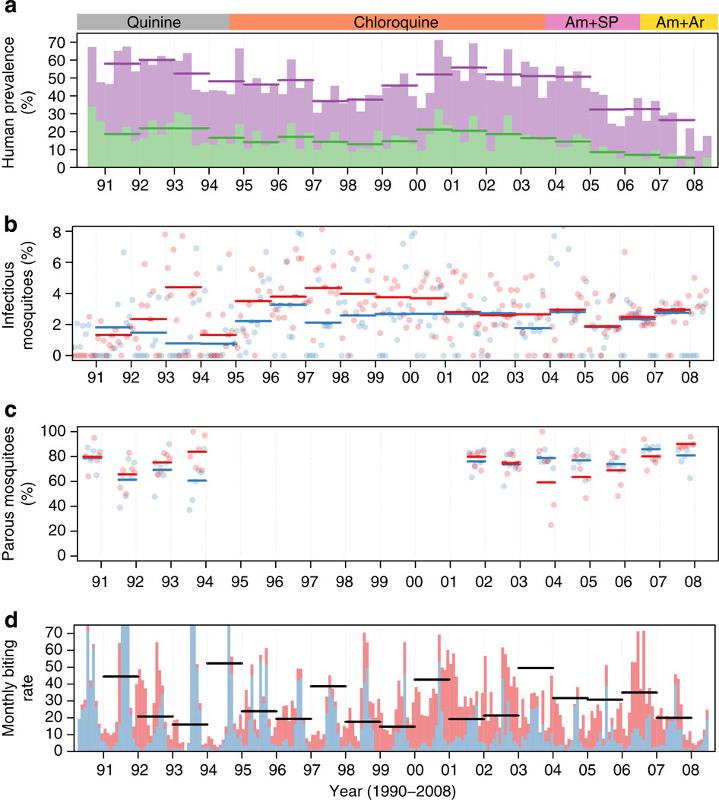
In the article ['Human-to-mosquito transmission effciency increases as malaria is controlled'] (http://www.gphysics.net/downloads/medicine/Churcher_et_al-2015-Nature_Communications.pdf) by Thomas S. Churcher, Jean- Francois Trape and Anna Cohuet in Nature Communications published on January 19, 2015 look at the curves seen in the image below:

We rescue that the fraction of mosquitoes
On the other hand about 30 bites per month are observed. Therefore the probability of daily bite
If you think about measures you can study the years in which the number of bites receded and determine the cause of this. As an example, if it were detected that in a year of drought the rate falls, it could be concluded that with drainage measures, areas prone to inhabit mosquitoes with malaria can be dried. In this case, the data of said favorable years can be taken to determine a set of data that would be given in the case of taking measures. This is how a reduction of 30 to 15 bites per month would lead to measures that the probability of being bitten
Note: It is important to keep in mind that the
ID:(8199, 0)
