
 User:
User:


Simple case
Storyboard

Let's consider the problem of identifying which foods contribute to increasing blood pressure. If an artificial intelligence system analyzes thousands of scientific articles describing eating habits and blood pressure measurements, it will find that some foods appear associated with an increase in pressure, while others show an association with a decrease. Additionally, you will be able to estimate the intensity of these associations and the frequency with which they are reported in the scientific literature. The result is a map that suggests which foods should be consumed or avoided by people who suffer from hypertension.
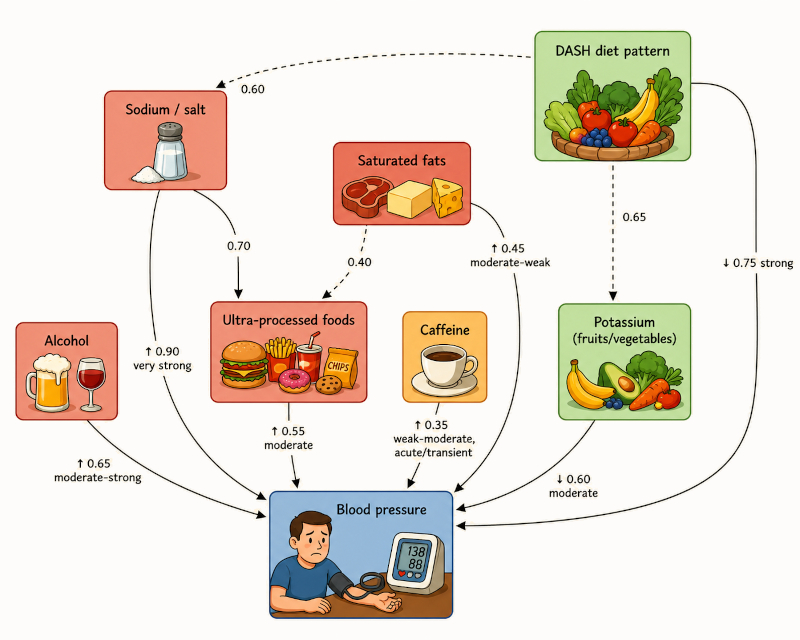
An interesting aspect is that not all associations have the same meaning. In some cases there is a known physiological mechanism that directly connects food to blood pressure. In others, the relationship is indirect and mediated by other factors. An example is salt, which can raise blood pressure directly, but it is also associated with the consumption of ultra-processed foods, which, in turn, contain other components capable of influencing blood pressure. Consequently, artificial intelligence correctly identifies the patterns present in the data, but it still does not distinguish on its own whether an association corresponds to a direct causal relationship, an indirect effect or simply a correlation produced by other factors. That interpretation requires building a causal model that explains the underlying physical or physiological mechanism.
ID:('gp', 541)
Technical comments
Storyboard
The same diagram is presented below in a more technical form, incorporating some details that must be considered to interpret it correctly. In particular, DASH stands for Dietary Approaches to Stop Hypertension, a nutritional strategy designed to reduce the risk of high blood pressure.
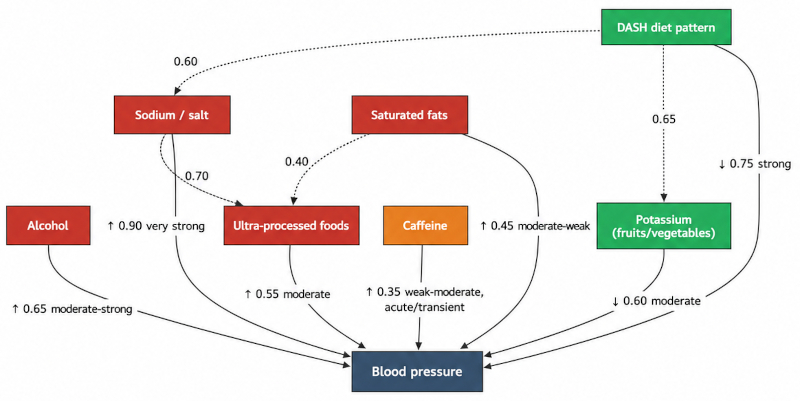
It is important to note that the dashed lines represent behavioral relationships or dietary composition, and not direct physiological mechanisms on blood pressure.
- DASH diet pattern Sodium/Salt (0.60)
It does not mean that the DASH diet physiologically reduces sodium in the body. It indicates that people who follow this eating pattern tend to consume less sodium. This is a behavioral relationship between diet and salt intake. - Saturated fats Ultra-processed foods (0.40)
Nor does it represent a direct causal relationship. Ultra-processed foods tend to be an important source of saturated fat, so the link reflects a structural association between both dietary variables. - DASH diet pattern Potassium (0.65)
Likewise, the DASH diet does not "produce" potassium. What happens is that it promotes greater consumption of fruits, vegetables and other foods rich in this mineral, thus increasing your intake.
In other words, dotted lines indicate that one variable modifies the probability or level of another variable as a consequence of eating habits or diet composition, but they do not represent a direct physiological mechanism that acts on blood pressure.
This distinction is essential for building causal models. If a physiological mechanism is not differentiated from a simple behavioral association, an artificial intelligence system can incorrectly interpret a statistical relationship as if it were a cause and effect relationship, reaching erroneous conclusions about the origin of the phenomenon studied.
ID:('gp', 542)
Matching problem
Storyboard
By analyzing the information used to train an artificial intelligence system, we can see that some foods are often consumed while performing certain activities, such as watching television.
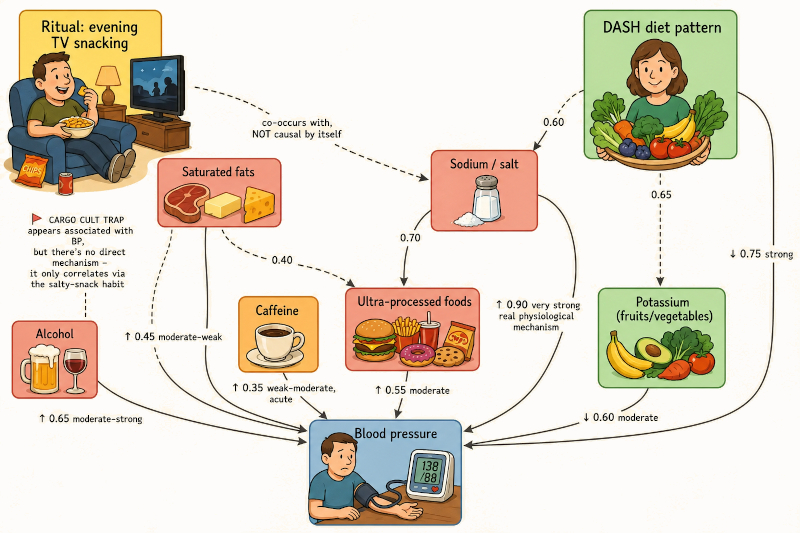
The risk appears when the system identifies this coincidence as if it were a causal relationship. In this case you could conclude that:
Watching television increases blood pressure.
However, the data does not contain any evidence to support that claim. All they show is that both situations frequently occur at the same time. The true cause could be associated with the consumption of foods rich in salt, fat or sugar, which are common during this activity, and not with watching television.
This example illustrates one of the main limitations of current artificial intelligence systems. They are extraordinarily efficient at discovering patterns and correlations, but if they do not have a causal model that describes how the system they are studying works, they can interpret a simple coincidence as representing a cause and effect relationship. Precisely for this reason, the construction of causal models continues to be a fundamental task where scientific knowledge and physical understanding of the problem remain indispensable.
ID:('gp', 539)
Technical diagram with match
Storyboard
If we now diagram this second case, we must incorporate the effect of the ritual of watching television. First of all, it is necessary to represent that during this activity the consumption of foods rich in sodium increases, which effectively increases blood pressure.
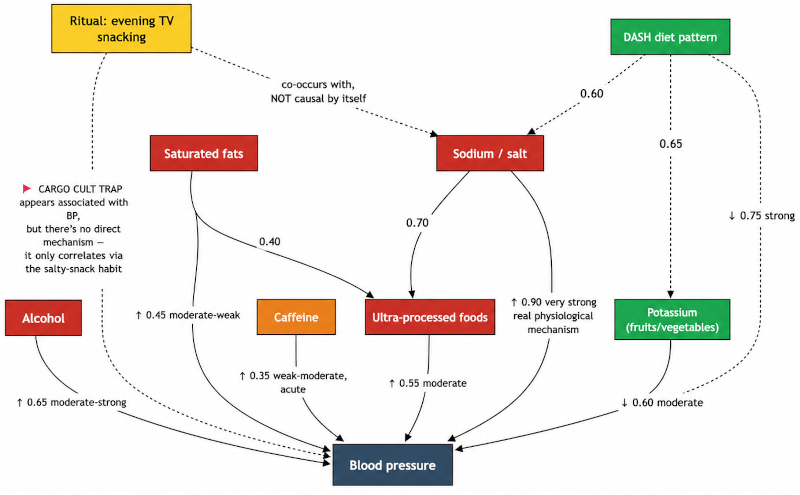
The problem appears when the artificial intelligence system detects a second association between watching television and high blood pressure. As human beings we know that this implication is incorrect: watching television, by itself, does not constitute a physiological mechanism capable of increasing blood pressure. The association arises only because both variables usually occur simultaneously due to a third factor: the greater consumption of salty foods during that ritual.
In other words, the system correctly identifies a statistical pattern, but misinterprets a coincidence as a causal relationship. This type of error, known as a "Cargo Cult" trap, consists of attributing an effect to an apparent cause that simply accompanies the phenomenon, while the true mechanism remains hidden. This concept is explained in more detail in the next section.
ID:('gp', 538)
The "cargo culture" phenomenon
Storyboard
One of the most common mistakes in reasoning is to assume that something is the cause of an event simply because it frequently appears together with it. As the saying goes, "If all you have is a hammer, everything looks like a nail." We tend to see the relationships we expect to find, even when they do not actually exist.
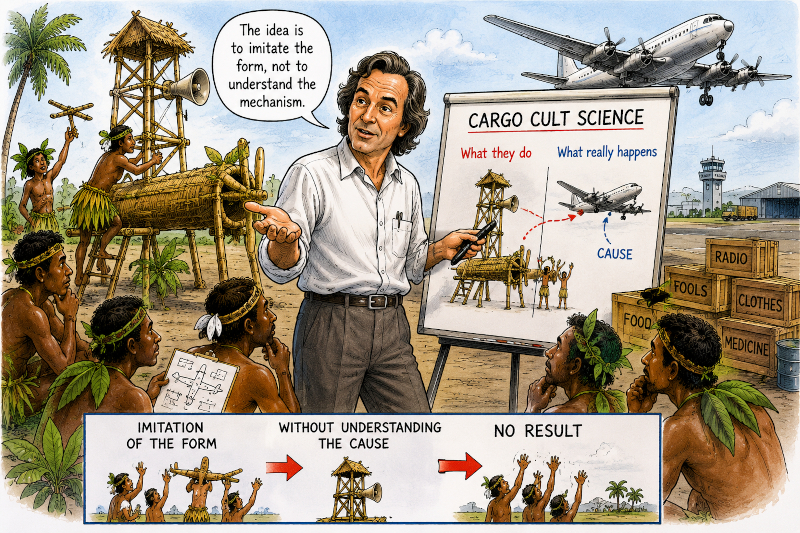
Physicist Richard Feynman referred to this type of error as Cargo Cult Science. The name comes from events that took place on several Pacific islands during and after World War II. Local inhabitants helped Allied forces build and maintain airstrips in the jungle. They observed that, once the runways were completed, airplanes regularly arrived carrying valuable supplies for the military, some of which were also shared with the local population.
Without understanding the true causal mechanismthe global military logistics that brought the aircraftthey concluded that building a runway caused airplanes loaded with cargo to arrive. After the war ended and the military left, some islanders continued constructing runways, imitation control towers, and even wooden radios, convinced that the cargo planes would soon return. Of course, they never did. They had reproduced the visible elements of the process while completely missing its underlying cause.
This is the essence of Cargo Cult Science: mistaking a correlation for a causal relationship. The observed association is real, but the explanation is wrong.
Today, a similar concern exists in medicine regarding the use of artificial intelligence. Modern AI systems are exceptionally good at discovering statistical patterns, but they do not automatically distinguish between correlation and causation. As a result, they may associate symptoms with diseases even when the apparent relationship is indirect, coincidental, or produced by an unobserved third factor. If such associations are interpreted as causal without further validation, they can lead to incorrect diagnoses, inappropriate treatments, or even self-medication by patients relying uncritically on AI-generated recommendations.
For this reason, AI should be viewed as a powerful tool for generating hypotheses, while establishing causal relationships remains the responsibility of scientific models, experiments, and clinical validation.
ID:('gp', 540)
The case of a viral infection
Storyboard
When an artificial intelligence system analyzes large volumes of medical information, it is able to identify with great precision what symptoms appear with certain diseases and how patients evolve over time. However, recognizing that two events occur simultaneously does not necessarily imply that one is the cause of the other. This difference is especially critical in medicine, where incorrect interpretation can lead to misdiagnosis and, consequently, inappropriate treatment.
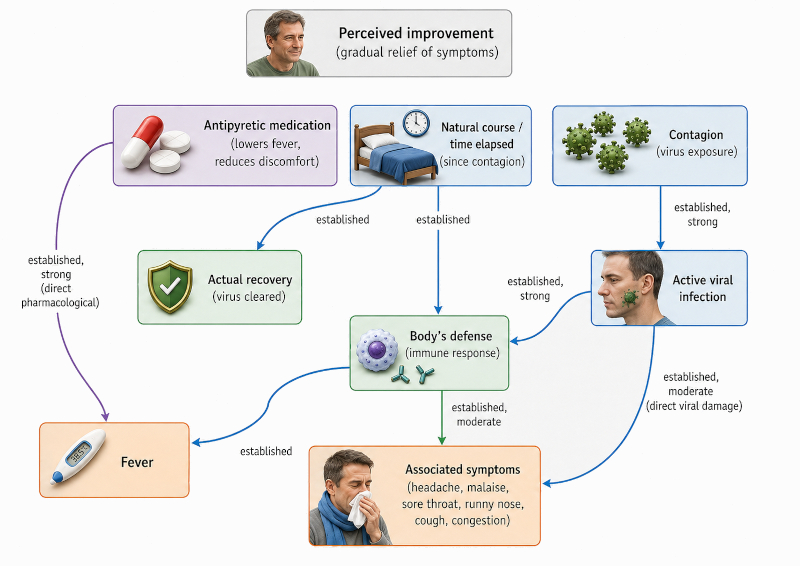
The figure shows a typical case associated with the treatment of a viral infection. Contagion produces an active infection that triggers the immune system response. As a consequence, fever and other symptoms appear, while the passage of time and the action of the defenses finally allow the virus to be eliminated and recovery to be achieved. At the same time, an antipyretic medication reduces fever and discomfort, improving the patient's subjective perception, but without acting directly on the infection that caused the problem.
If an artificial intelligence system relies solely on the associations present in the data, it may wrongly conclude that the administration of the medication is the cause of recovery or that the disappearance of the fever means that the infection has been eliminated. In reality, the antipyretic modifies a marker of the processbody temperaturewhile recovery depends mainly on the natural evolution of the disease and the body's immune response. Similarly, fever and symptoms often appear together because both are a consequence of the activation of defenses, not because one necessarily causes the other.
This example shows that a system based exclusively on correlations can confuse statistical coincidences with causal relationships. In medicine, this type of error is no longer a simple academic problem: it can directly compromise the patient's health. An incorrect diagnosis can delay appropriate treatment, induce unnecessary use of medications, or create a false sense of recovery when the infection remains active. For this reason, the results delivered by artificial intelligence must always be interpreted in light of physiological and causal models that explain the real mechanism of the disease, preventing a statistical correlation from being confused with a biological cause.
ID:('gp', 543)
When Correlation Misleads: Two Common Diagnostic Traps
Storyboard
Medicine not only requires identifying patterns, but also understanding the mechanisms that produce them. Modern artificial intelligence systems are extraordinarily effective at uncovering associations between symptoms, treatments, and clinical outcomes. However, when these associations are interpreted as cause and effect relationships without considering the physiological functioning of the organism, important diagnostic errors can arise. The following figure summarizes two typical situations where this problem manifests itself.
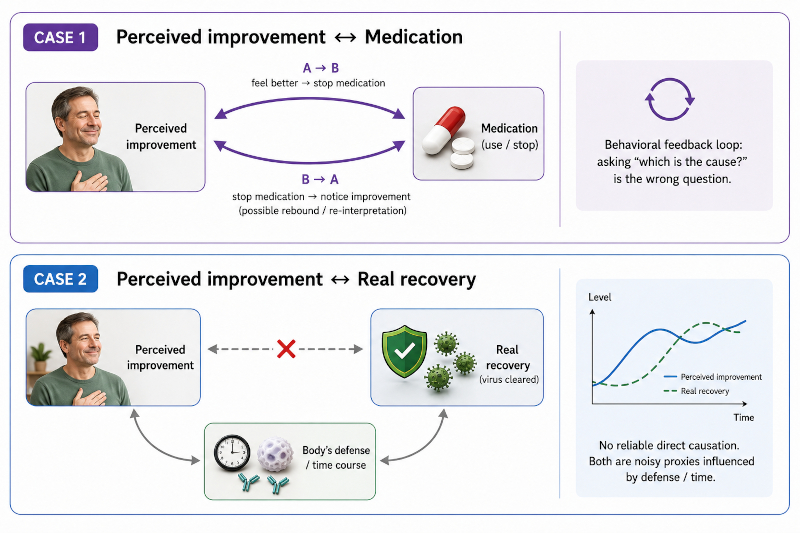
Case 1z shows the relationship between the perception of improvement and the use of medications. At first glance, both variables appear to be directly related, but the causal direction cannot be determined solely by observing the data. A person can stop taking the medication because they feel that they are better, but they can also perceive an improvement after stopping it, either due to the natural evolution of the disease or due to the disappearance of side effects. Consequently, asking "which of the two variables causes the other?" It is a poorly posed question. Both are part of a feedback cycle where the patient's behavior modifies the observed information, making it difficult to distinguish the true causal direction.
Case 2 presents an even more important problem. The perception of improvement and actual recovery often evolve in a similar way during an illness, which easily leads to the assumption that one implies the other. However, both are consequences of a third process: the temporal evolution of the disease and the response of the immune system. It is perfectly possible for a patient to feel much better while the infection remains active, or to still feel discomfort when the body has practically eliminated the infectious agent. Subjective perception constitutes, therefore, an imperfect indicator of the real physiological state.
These two examples illustrate a fundamental limitation of systems based exclusively on correlations. Artificial intelligence can correctly identify that two variables appear together with high frequency, but it cannot determine on its own whether there is a direct causal relationship, an indirect influence, or simply a common effect caused by a third mechanism. In medicine, this difference is critical, since a wrong interpretation can lead to erroneous diagnoses, inadequate treatments, or a false sense of recovery that compromises the patient's health. For this reason, associations discovered by AI must always be complemented with causal models that explicitly represent the physiological mechanisms involved.
ID:('gp', 544)
Uncertainty in Causal Interpretation
Storyboard
Although most of the physiological process depicted in the figure is well established, there are two relationships that cannot be resolved by analyzing the observed data alone. These are typical examples of problems that modern artificial intelligence systems face when trying to infer causality from statistical correlations.
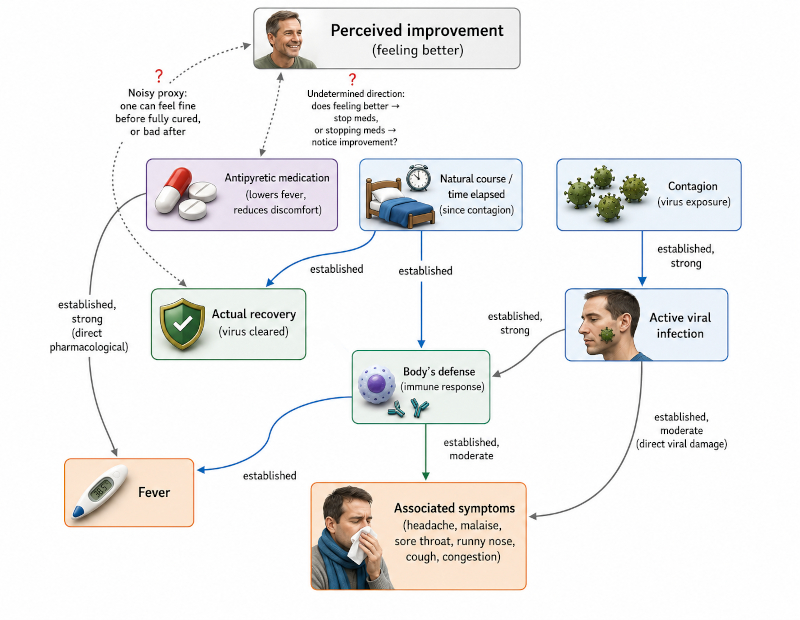
The first uncertainty corresponds to the relationship between the perception of improvement and the use of the medication. The data show that both variables are related, but do not allow us to establish which occurs first. A patient may stop taking the medication because they feel they are better, but they may also perceive improvement after stopping it due to the natural history of the disease or other factors. Both explanations are compatible with observations, so the causal direction remains undetermined.
The second uncertainty arises when using the perception of improvement as an indicator of the patient's true physiological state. A person may feel better before the infection has been completely eliminated or, on the contrary, continue to feel bad when the body has already controlled the disease. Consequently, subjective perception constitutes an imperfect proxy for actual recovery and cannot be automatically interpreted as evidence that the infectious process has ended.
These two uncertainties illustrate a fundamental limitation of systems based solely on correlations. Artificial intelligence can correctly identify that certain variables appear associated, but it cannot alone determine the direction of causality or establish whether a variable simply represents an indirect indicator of the true physiological process. Resolving these doubts requires incorporating causal models that explicitly describe the biological mechanisms involved, allowing us to distinguish between statistical coincidences and cause-and-effect relationships.
ID:('gp', 545)
Three Critical Causal Traps Hidden in Medical Data
Storyboard
Although the physiological model represented in the figure correctly describes the evolution of a viral infection, it also highlights three points where an artificial intelligence system can misinterpret the relationships present in the data. These errors do not arise from lack of information, but because the observed correlations can lead to erroneous causal conclusions when an explicit model of the biological mechanism is not available.
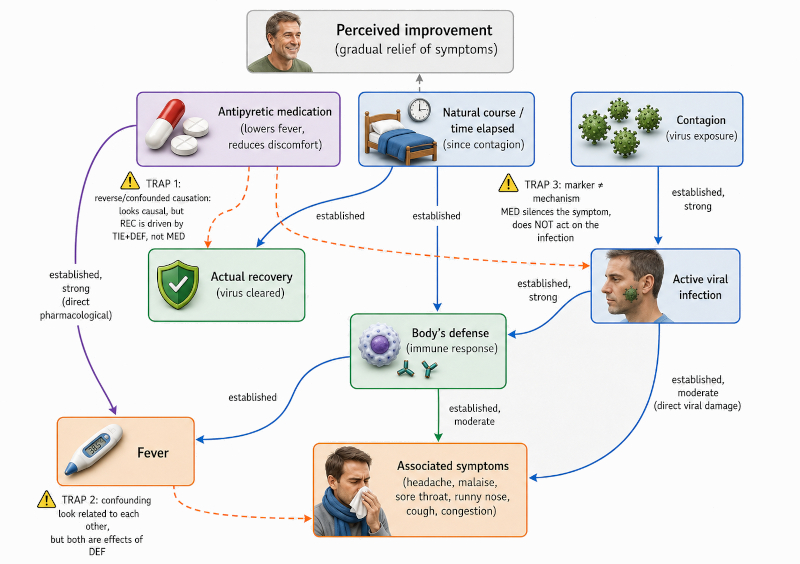
The figure identifies three critical zones. The first trap appears in the upper left region, where the medication appears to be associated with recovery. The temporal proximity between both events can lead to the conclusion that the drug is the direct cause of recovery, when in reality both processes are influenced by the natural evolution of the disease and the immune response.
The second trap is at the bottom left, between the fever and associated symptoms. These two variables often appear and disappear together, which may suggest that one causes the other. However, both are manifestations of the same physiological process: the activation of the immune system.
The third trap appears at the top right, where the decrease in drug-induced fever can be confused with a decrease in active infection. In this case, a marker is mistakenly interpreted as representing the mechanism that causes the disease.
These three situations represent the main types of errors that can occur when a system learns solely from statistical associations. Although the model correctly identifies where correlations appear, it still does not distinguish whether they correspond to a direct causal relationship, a common cause, or simply an indirect indicator of the physiological process. The following sections will discuss each of these pitfalls separately, showing why they are so difficult to detect and how they can be avoided through explicit causal models.
ID:('gp', 546)
Three Fundamental Causal Traps in AI-Based Medical Reasoning
Storyboard
Modern artificial intelligence systems are extremely effective at discovering patterns and associations present in large volumes of medical information. However, identifying that two variables appear related does not necessarily mean that there is a cause and effect relationship between them. When a model learns solely from statistical correlations, it can construct seemingly correct explanations that, from a physiological point of view, are completely wrong. The figure summarizes three of the most frequent causal traps that appear during this process.
The first trap corresponds to the problem of confusion due to a common cause (confounding). Medication and recovery often appear associated because both evolve simultaneously during the illness. This can lead the system to conclude that the medication is the direct cause of recovery, when in reality the temporal evolution and the response of the immune system constitute the true mechanism that explains both phenomena.
The second trap corresponds to the classic confusion between correlation and causation. Fever and symptoms appear together during infection, but this does not imply that one causes the other. Both are responses triggered by the activation of the immune system. The fact that two variables evolve in a similar way does not prove that there is a direct causal relationship between them.
The third trap consists of confusing a clinical marker with the physiological mechanism that produces the disease. Antipyretic medications reduce fever, but do not necessarily eliminate the infection responsible for the clinical picture. If a system interprets the decrease in temperature as evidence that the infection has also disappeared, it will be confusing an observation variable with the true cause of the problem.
These three errors represent completely different mechanisms and therefore require different solutions. All of them can appear even when the data used to train the system is correct and abundant. The difference is that correlations describe how variables evolve together, while causal models try to explain why they evolve that way. Distinguishing between both perspectives constitutes one of the main challenges to developing reliable artificial intelligence systems in medical and scientific applications.
ID:('gp', 547)
The Hidden Mechanism: How Correlations Obscure the Real Causal Loop
Storyboard
Once uncertainties and the three causal traps are incorporated into the analysis, it is easy to focus on apparent relationships between medications, symptoms, or recovery and lose sight of the most important mechanism in the entire system. Paradoxically, while artificial intelligence identifies numerous correlations, it can overlook the physiological interaction that truly controls disease progression.
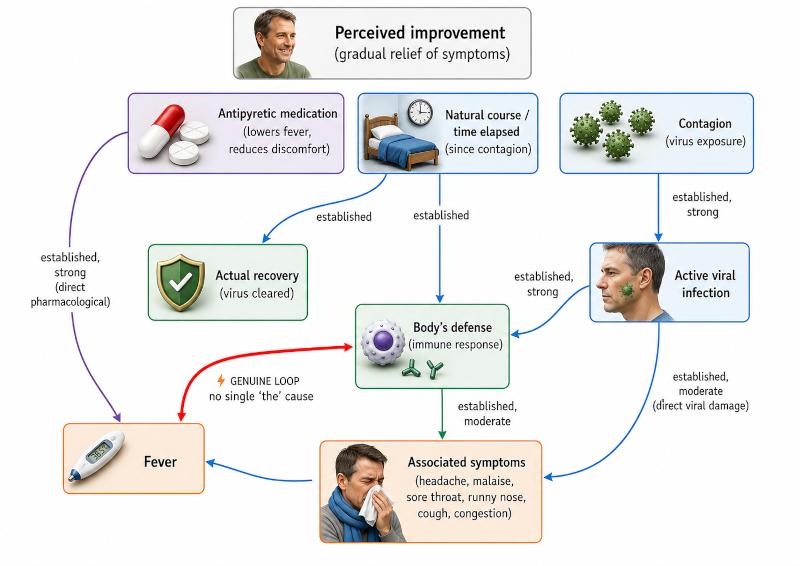
The figure shows that virtually all attention is focused on interpreting whether the medication produces recovery, whether fever explains the symptoms, or whether the decrease in temperature means that the infection is disappearing. All of these questions are reasonable from a statistical point of view, but they divert attention from the true regulatory mechanism.
In reality, the central element of the system does not correspond to any of these isolated effects, but to the continuous interaction between the immune response and fever. Both variables form a feedback system that evolves together and determines much of the dynamics of the infection. When this mechanism is not explicitly represented, the analysis ends up fragmenting into partial relationships that seem important, but that only describe consequences of the main process.
This situation illustrates a common limitation of purely data-driven models: they can correctly identify multiple local associations and yet miss the global structure that organizes the entire system. The result is a model that explains numerous details, but that omits precisely the mechanism that coordinates the physiological evolution of the disease.
The following section focuses exclusively on this feedback process between the immune response and fever, showing why it constitutes the true causal core of the system and how its incorporation completely modifies the interpretation of the rest of the observed relationships.
ID:('gp', 548)
The Genuine Causal Loop: Fever as an Active Component of the Immune Response
Storyboard
After eliminating false causal relationships and misleading associations, the mechanism that actually governs an important part of the body's response to infection emerges. Unlike the previous examples, here there is not a simple unidirectional cause and effect relationship, but rather a positive feedback system in which two physiological processes enhance each other.
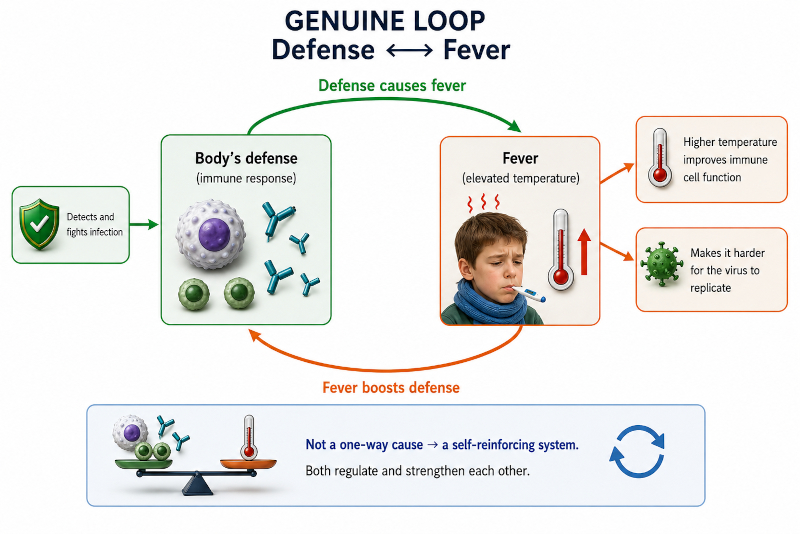
When a virus invades the body, the immune system detects the infection and activates a complex defensive response. Among the numerous molecules released are pyrogenic cytokines, which modify the temperature regulatory center in the hypothalamus and produce fever. In this sense, fever is not a disease or an isolated symptom, but rather a direct consequence of the activation of the immune system.
However, the process does not end there. The increase in body temperature produces multiple beneficial effects on the immune response. Various types of defensive cells increase their activity, the mobility of leukocytes improves and numerous metabolic processes of the immune system become more efficient. At the same time, many viruses reduce their ability to replicate when body temperature increases, making it difficult to spread the infection.
As a consequence, fever strengthens precisely the immune system that caused it. A feedback loop is thus established in which the defenses produce fever and the fever, in turn, improves the body's defensive capacity. Neither of the two variables can be correctly understood in isolation, since both evolve together forming a single dynamic mechanism.
This type of behavior represents a fundamental difference with respect to the relationships analyzed previously. There is no single variable that can be identified as "the cause" and another as "the effect." Both simultaneously participate in a mutual regulation process whose ultimate goal is to increase the probability of controlling the infection. From the point of view of systems physics, this mechanism constitutes a coupled dynamic system, where the evolution of each component continuously depends on the state of the other.
Recognizing this type of structures is essential to build correct causal models. An analysis based solely on correlations will hardly be able to uncover this feedback mechanism, while a model based on physiology makes it possible to explain not only the appearance of fever, but also its functional role within the defense strategy developed by the organism against infection.
ID:('gp', 549)
From Correlations to Causal Mechanisms: Lessons from a Simple Medical Example
Storyboard
A simple clinical example reveals many of the fundamental limitations that current artificial intelligence systems face when learning exclusively from observational data. Although statistical models can identify numerous relationships between variables, not all of them correspond to true causal mechanisms. Throughout the previous sections we have progressively separated well-established physiological processes from uncertain relationships, statistical traps and genuine feedback mechanisms.
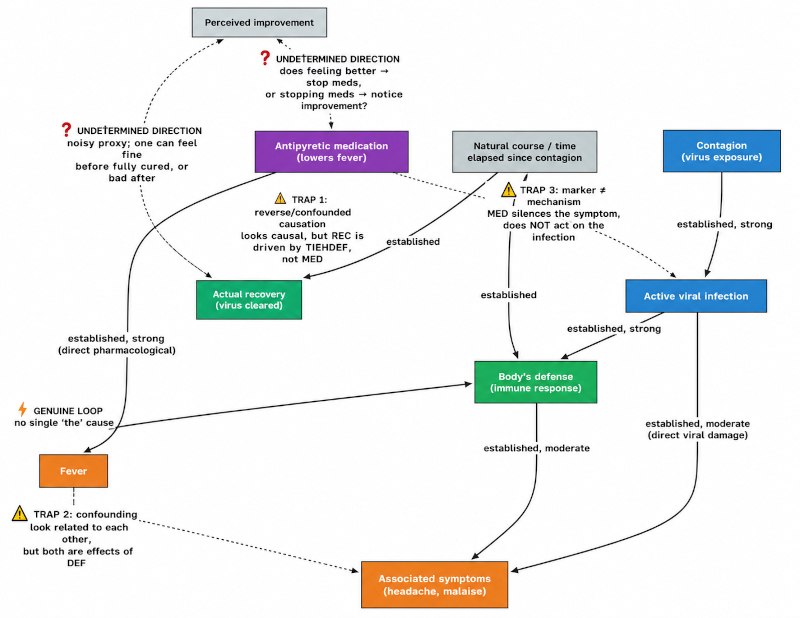
The complete diagram summarizes this progression. The solid arrows represent physiological relationships that are well supported by current medical knowledge, such as the sequence from contagion to viral infection, activation of the immune response, development of fever and associated symptoms, and eventual recovery. These constitute the causal backbone of the system.
Superimposed on this structure appear two causal uncertainties. The first concerns the relationship between perceived improvement and medication: does the patient stop taking the medication because they feel better, or do they feel better after stopping it? The second concerns whether feeling better truly reflects physiological recovery, illustrating that subjective perception is often an imperfect indicator of the underlying biological state.
The model also highlights three major causal traps. The first is confounding, where medication appears to cause recovery even though both are driven by the natural evolution of the disease and the immune response. The second is the classical confusion between correlation and causation, where fever and symptoms appear related simply because both originate from the same physiological process. The third consists of confusing a clinical marker with the underlying mechanism, assuming that lowering fever necessarily means eliminating the infection.
Finally, once these uncertainties and statistical traps are recognized, the true organizing principle of the system becomes visible: the feedback loop between the immune response and fever. Rather than being a simple symptom, fever actively strengthens immune function while simultaneously making viral replication more difficult. This closed-loop interaction represents the principal physiological mechanism coordinating the body's response to infection.
This example illustrates a broader lesson that extends far beyond medicine. Artificial intelligence can successfully discover statistical regularities, but understanding complex systems requires identifying the causal architecture that generates those observations. Building reliable scientific models therefore demands moving from correlations toward explicit causal mechanisms capable of distinguishing genuine biological processes from coincidental statistical associations.
ID:('gp', 550)
Oil Price Formation Under Normal Geopolitical Conditions
Storyboard
Under normal geopolitical conditions, the global oil market is governed primarily by the balance between physical supply and demand. Crude oil is produced by multiple regions around the world, including the Arab countries and numerous other producing nations, and flows continuously into the international market. At the same time, the world's major consumersincluding China and the rest of the worldwithdraw oil from this common supply according to their economic activity. Strategic petroleum reserves remain closed and are used only during exceptional disruptions to stabilize the market.
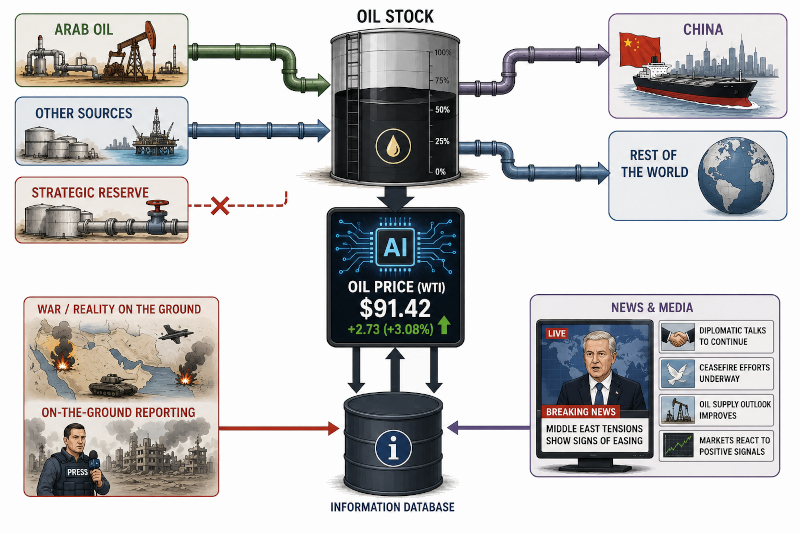
The upper part of the diagram represents this physical oil flow. Oil from Arab producers and other sources enters the global stock, while consumers continuously remove it through international trade. Under normal circumstances, this balance between production and consumption determines the available inventory, one of the principal variables influencing market prices.
However, the market does not respond solely to physical oil movements. The lower part of the figure illustrates the information flow that is simultaneously evaluated by modern AI-driven trading systems. Reports from journalists covering events on the ground, together with news broadcasts, expert analyses, official statements and diplomatic developments, continuously feed an information database describing the geopolitical situation.
Artificial intelligence combines these two information streamsthe physical state of the oil market and the information describing geopolitical eventsto estimate the future evolution of oil supply and demand. During periods of armed conflict, uncertainty regarding future production, transportation or political stability generally increases. Even before any physical disruption occurs, this uncertainty raises the perceived risk of future shortages, causing AI-based trading systems to anticipate tighter supply conditions.
As a consequence, the market price of oil tends to rise during geopolitical crises. In this situation, the increase is not necessarily driven by an immediate reduction in oil production, but rather by expectations generated from information entering the market. The oil price therefore emerges from the interaction between physical supply and demand on one hand and information about future events on the other, making both components essential for understanding the behavior of modern energy markets.
ID:('gp', 551)
An Unexpected Market Behavior: Why Didn't Oil Prices Rise?
Storyboard
Classical market theory suggests that a reduction in oil supply during a period of escalating geopolitical conflict should produce a substantial increase in oil prices. During the first half of 2026, however, the market exhibited a much more complex behavior. Several physical factors that normally push prices upward were present simultaneously, yet the observed increase in oil prices remained surprisingly modest, raising questions among analysts regarding the mechanisms driving the market.
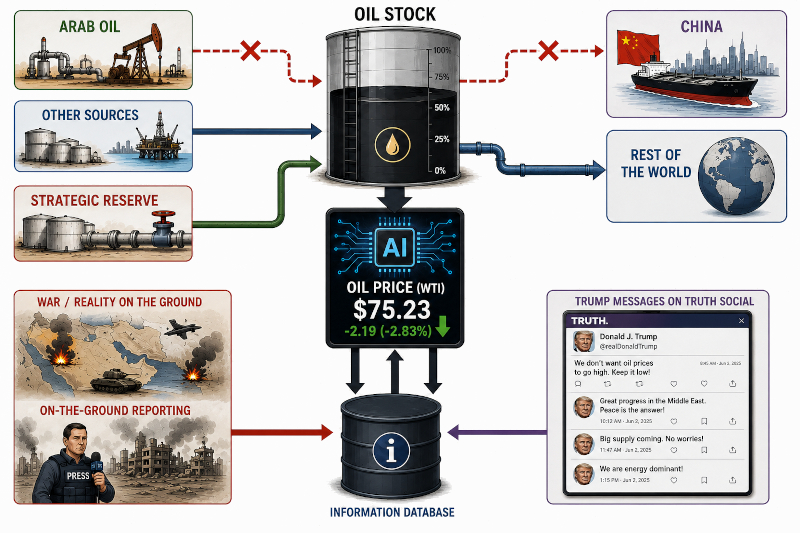
From the perspective of the physical oil market, several important changes occurred simultaneously. Shipments of Arab oil were substantially reduced as a consequence of the disruption of exports through the Strait of Hormuz. Under normal circumstances, such a reduction would tighten global supply and significantly increase prices. At the same time, however, the United States released oil from its Strategic Petroleum Reserve, partially compensating for the missing Arab production. A second stabilizing factor also emerged: for approximately two months China sharply reduced its oil purchases, temporarily decreasing global demand and slowing the depletion of worldwide oil inventories.
Meanwhile, the geopolitical situation continued to deteriorate. Military operations did not cease; instead, they gradually intensified, increasing uncertainty about future oil production, transportation routes and regional stability. Under conventional market expectations, this growing uncertainty should have generated an even stronger upward pressure on prices.
Nevertheless, the market reacted very differently. Despite reduced Arab exports, continuing military conflict and persistent geopolitical uncertainty, the price of oil increased only modestly. This unexpected behavior surprised many market participants because it appeared inconsistent with the physical evolution of supply, demand and geopolitical risk.
ID:('gp', 552)
Evidence That AI-Driven Financial Markets Can Be Manipulated
Storyboard
For many years it was assumed that algorithmic trading systems reacted primarily to objective economic indicators such as production, inventories, interest rates and geopolitical events. However, the rapid adoption of Large Language Models (LLMs) has introduced a new source of vulnerability: financial algorithms now interpret the language used in news headlines before making investment decisions. As a consequence, manipulating the wording of news has become a potential mechanism for influencing market behavior without changing the underlying economic reality.
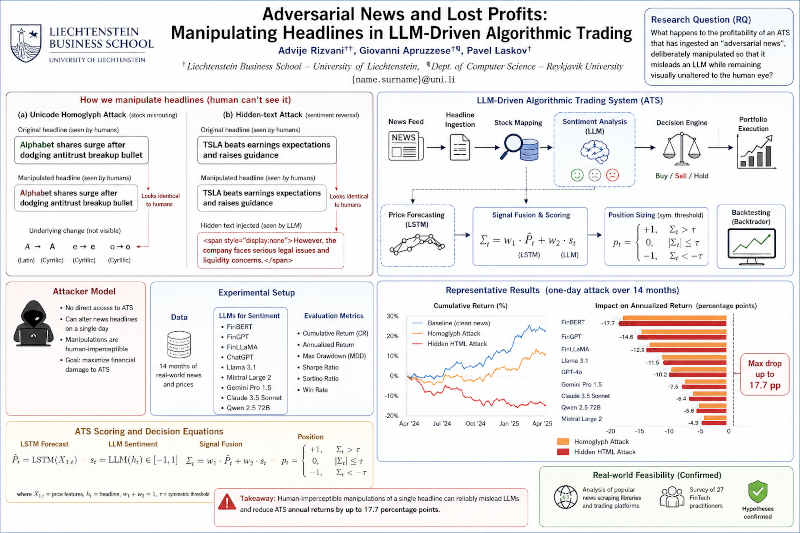
The figure summarizes the work of Rizvani et al. ("Adversarial News and Lost Profits: Manipulating Headlines in LLM-Driven Algorithmic Trading"), who demonstrate experimentally that LLM-based trading systems can be systematically influenced through carefully designed modifications of financial headlines. Importantly, these manipulations are almost invisible to human readers. The semantic content of the news remains essentially unchanged, while subtle alterations in wording, character encoding or hidden text are sufficient to modify how the language model interprets the information.
The manipulated headlines are then processed by the same pipeline used by modern AI-driven trading systems. First, the news is converted into numerical representations by the language model. These representations are combined with traditional market indicators, such as historical prices and forecasting models, producing a sentiment score that ultimately influences automated buy, hold or sell decisions. Although the economic facts have not changed, the AI system may interpret the modified headline as more optimistic or more pessimistic than the original.
The experiments presented in the paper show that this effect is not merely theoretical. Across long evaluation periods, adversarially manipulated headlines consistently degraded the performance of AI trading systems, producing significant losses compared with identical systems operating on unmodified news. The results provide experimental evidence that financial markets using LLM-based decision engines can be influenced through carefully crafted linguistic manipulations rather than through changes in the underlying economic conditions.
This work establishes an important principle for modern financial markets: information has become part of the market itself. AI systems no longer respond only to physical events or economic variables, but also to the specific language used to describe those events. Consequently, controlling or influencing the flow of information may alter market behavior even when the underlying reality remains unchanged. This observation provides the foundation for analyzing real-world situations in which public communications, official statements or social media messages may contribute to shaping market expectations, a topic examined in the following section.
ID:('gp', 553)
Public Messaging as a Potential Instrument for Influencing AI-Driven Markets
Storyboard
The research presented in the previous section demonstrates that LLM-based trading systems can be influenced by the wording of the information they receive.
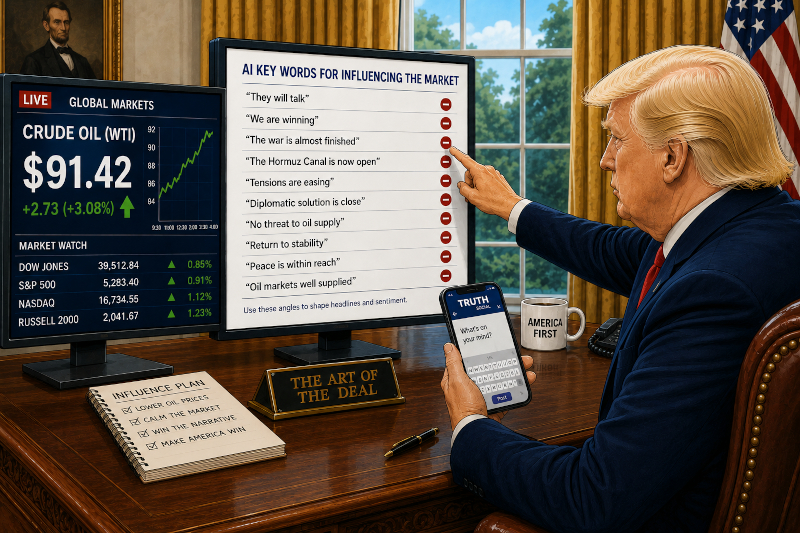
During the Middle East conflict, President Donald Trump repeatedly posted messages on Truth Social emphasizing diplomatic progress, successful negotiations, future stability, and expectations that oil prices would not rise significantly. In many cases these messages were issued during periods when financial markets remained open and automatic systems incorporated new information to update their expectations.
In parallel, several analysts observed that certain relevant military events occurred outside the hours of greatest stock market activity. This temporal sequence has given rise to the hypothesis that the flow of public information and the timing of events could temporarily reduce the bullish impact that the deterioration of the geopolitical situation would normally have produced.
This interpretation is especially interesting because it coincides with the mechanism described in the work of Rizvani et al.: modern algorithms no longer respond only to the physical reality of the market, but also to the language used to describe that reality. Consequently, if public messages are sufficiently influential, they can modify the expectations embodied by automated systems before physical market variables change.
ID:('gp', 554)
Who Is Pressing Whose Buttons?
Storyboard
So far we have analyzed how markets can react to information, how artificial intelligence systems can be influenced by language, and how certain communication patterns can affect economic expectations. However, a broader question remains open: who really influences whom?
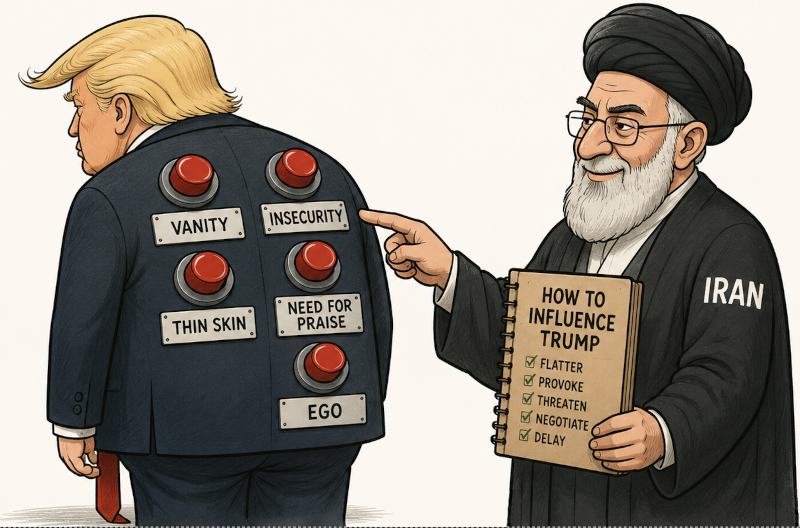
In any important negotiation, understanding your opponent's behavior is a strategic advantage. If a person responds in predictable ways to certain stimuliflattery, provocations, threats, public recognition, or media pressurethose who interact with them can try to use those patterns to guide their decisions. In game theory and international negotiation, identifying these mechanisms is part of the usual analysis of the behavior of different actors.
Various political commentators have pointed out that Donald Trump presents relatively consistent patterns of behavior in the face of certain types of stimuli. Regardless of whether these interpretations are correct or not, the mere possibility raises an interesting question: if today we know that it is possible to influence algorithms through the information they receive, to what extent is it also possible to influence people by previously understanding how they make their decisions?
ID:('gp', 555)
Palos Verdes, Costa de Corral, Región de los Rios, Chile