
Radiation range
Image 
Radiation is divided into that from the sun (mostly visible) and that from the earth (mostly infrared). When represented as a function of wavelength, it appears as follows:

Typical satellite measurements, such as those from the MODIS project, are taken in different channels.
The visible part is measured with three channels:
| Channels | Ranges [µm] | Relative Weights |
| Blue | 0.459-0.479 | 0.4364 |
| Green | 0.545-0.565 | 0.2366 |
| Red | 0.620-0.670 | 0.3265 |
The infrared part is estimated with the following channels:
| Channels | Ranges [µm] | Relative Weights |
| NIR | 0.841-0.876 | 0.5447 |
| 1.2 | 1.230-1.250 | 0.1363 |
| 1.6 | 1.628-1.652 | 0.0469 |
| 2.1 | 2.105-2.155 | 0.2536 |
The results from the first group are referred to as VIS, while those from the second group are referred to as NIR, although part of the observed spectrum falls within the visible range.To understand why the separation is made around 750 nm instead of 3 microns, as is normally defined for the infrared range, one must consider the behavior of the albedo. It shows a substantial increase for wavelengths around 750 nm and above, not just from 3 microns onwards (see the albedo chart as a function of wavelength).
ID:(9921, 0)
Solar radiation flow over the ocean surface
Model
Variables
Calculations
Calculations
Equations
Examples
The radiations reaching the surface of the ocean or emitted from it can be summarized in the following graph:
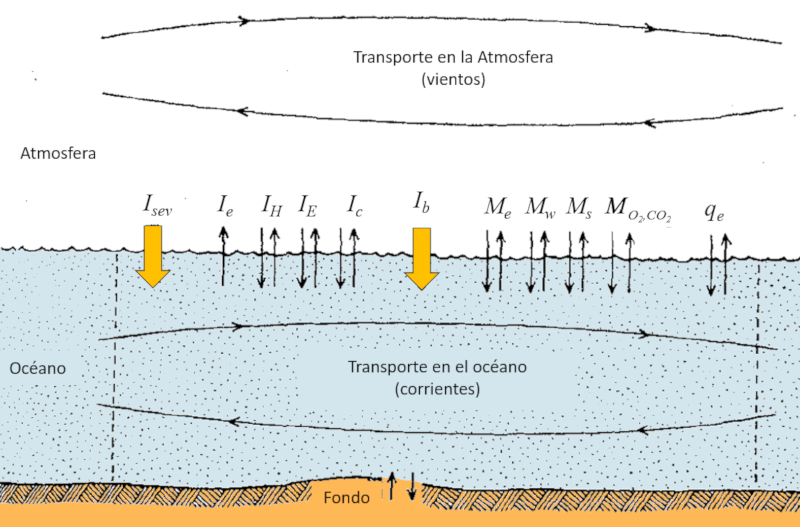
In summary:- $I_{sev}$: Net solar radiation.- $I_e$: Radiation emitted by the Earth.- $I_H$: Exchange due to droplet input/output.- $I_E$: Exchange due to water evaporation/condensation.- $I_c$: Exchange due to conduction.This graph provides a concise overview of the different forms of radiation interacting at the ocean's surface and the associated energy exchanges.
(ID 13497)
Radiation is divided into that from the sun (mostly visible) and that from the earth (mostly infrared). When represented as a function of wavelength, it appears as follows:
Typical satellite measurements, such as those from the MODIS project, are taken in different channels.
The visible part is measured with three channels:
| Channels | Ranges [ m] | Relative Weights |
| Blue | 0.459-0.479 | 0.4364 |
| Green | 0.545-0.565 | 0.2366 |
| Red | 0.620-0.670 | 0.3265 |
The infrared part is estimated with the following channels:
| Channels | Ranges [ m] | Relative Weights |
| NIR | 0.841-0.876 | 0.5447 |
| 1.2 | 1.230-1.250 | 0.1363 |
| 1.6 | 1.628-1.652 | 0.0469 |
| 2.1 | 2.105-2.155 | 0.2536 |
The results from the first group are referred to as VIS, while those from the second group are referred to as NIR, although part of the observed spectrum falls within the visible range.To understand why the separation is made around 750 nm instead of 3 microns, as is normally defined for the infrared range, one must consider the behavior of the albedo. It shows a substantial increase for wavelengths around 750 nm and above, not just from 3 microns onwards (see the albedo chart as a function of wavelength).
(ID 9921)
ID:(1540, 0)