Dissolution of salt in the ocean
Image 
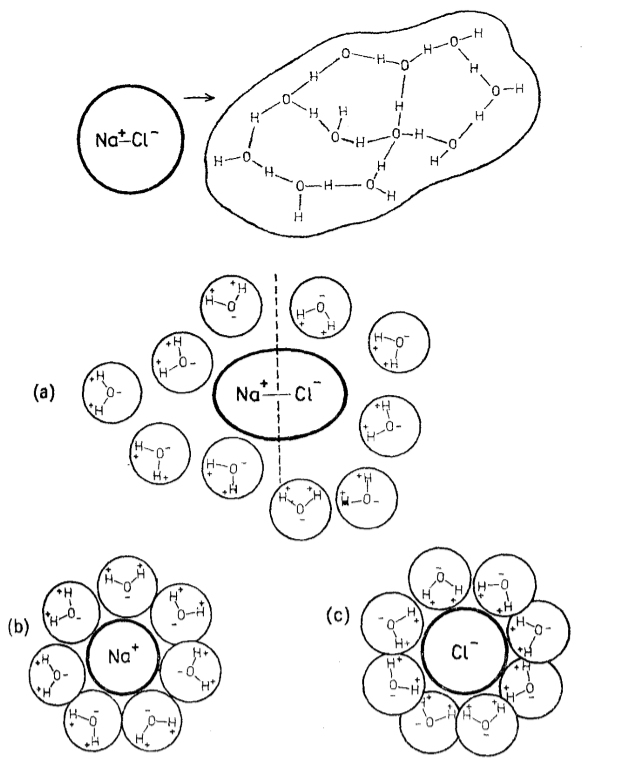
The ions in the salt dissociate and are surrounded by water molecules forming clusters of a size greater than that of the original ion:

ID:(11991, 0)
Salt ion hydrate
Image 
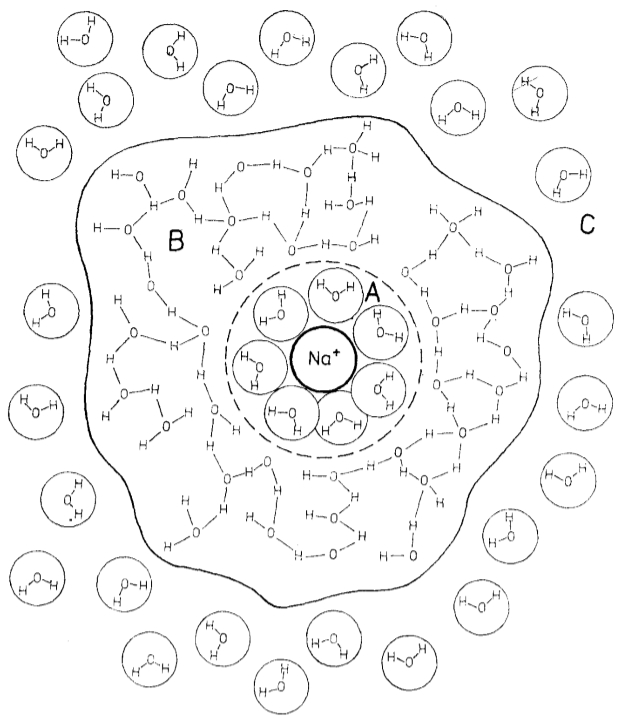
Once the ion is surrounded by water molecules, a second layer of molecules is formed, which are linked by bridges:

ID:(11992, 0)
Electric field acts on ion hydrate of salt
Image 
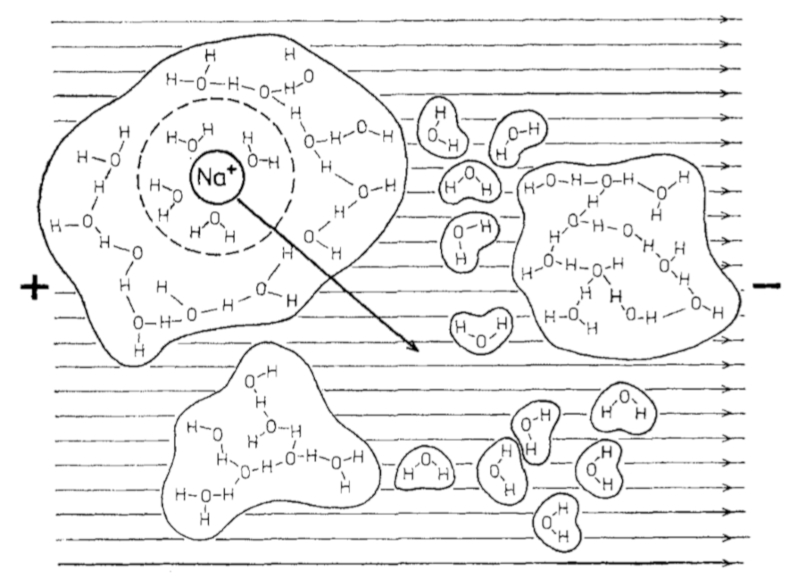
If an electric field is applied to water with salt ions, the latter begin to move towards the positive poles:

ID:(11993, 0)
Electrical conductivity as a function of salinity
Image 
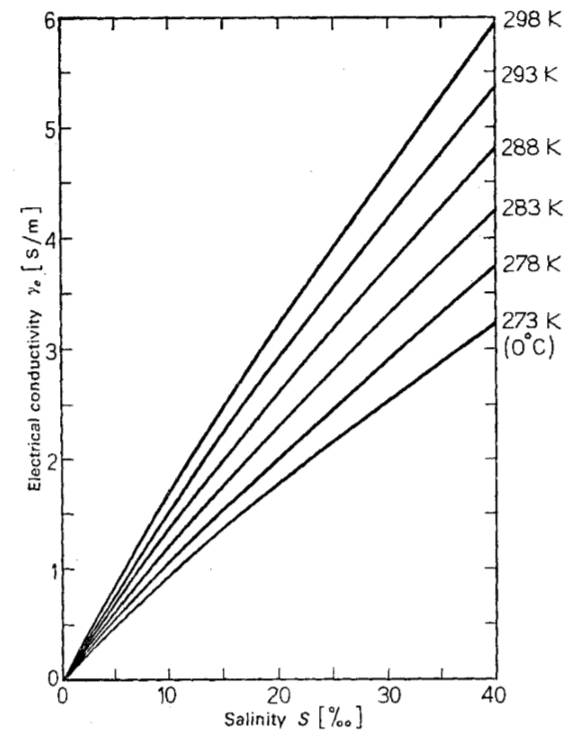
The electrical conductivity as a function of salinity and temperature that is explained by the greater presence of ions and the greater mobility at higher temperatures:

ID:(11994, 0)
Electrical conductivity as a function of pressure
Image 
Electrical conductivity as a function of pressure and temperature:

ID:(11995, 0)
Specific conductivity measurement of seawater
Equation 
The specific conductivity measured in seawater under atmospheric pressure can be empirically represented as
| \gamma_e = a T + b S + c T S + d |
ID:(11999, 0)
Values of electrical conductivity as a function of salinity
Image 
The following table shows electrical conductivity as a function of salinity:

ID:(11996, 0)
Medición de salinidad
Equation 
Dado que la resistencia del agua marina depende de su salinidad, se puede medir la resistencia para determinar el nivel de salinidad. Esto se hace comparando las conductividades de una muestra de agua marina con una solución standard de KCl (clorato de potasio). Se miden la conductividad especifica de ambas muestras a una temperatura de 15C y 1 atm de presión y establece la relación\\n\\n
K=\sqrt{\displaystyle\frac{\gamma_w}{\gamma_{KCl}}}
y calcula la salinidad con
| S = a_0 + a_1 K + a_2 K^2 + a_3 K^3 + a_4 K^4 + a_5 K^5 |
con
a_0=0.0080
a_1=-0.1692
a_2=25.3851
a_3=14.0941
a_4=-7.0261
a_5=2.7081
ID:(12424, 0)
