Special cases: El Niño y La Niña
Storyboard 
A special case is that of the child's current. In this the currents move, reducing for example the upwelling on the coasts of Chile and Peru, which has a direct effect on marine life.
ID:(1583, 0)
Normal circulation in the Pacific
Description 
Typically, along the equator over the Pacific Ocean, two convection zones are observed:
- One over the Philippines area, where air masses ascend and generate rainfall through condensation.
- Another in the South American region, where air masses descend and bring dry air to the Ecuadorian area.
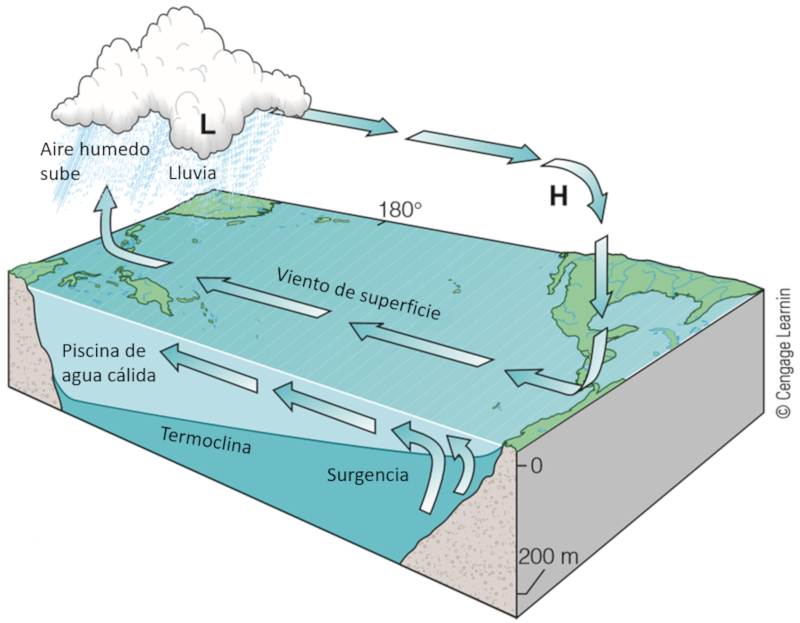
Between these two zones, there exists an east-west surface current and an opposing high-altitude current.
ID:(11748, 0)
Southern Pacific Oscillation (ENSO): El Niño
Description 
The problem with currents along the Pacific is that they cover approximately 10,000 km while having a thickness of only about 20 km (the distance between the surface current and the deep current). If the ocean has sufficient temperature, this can trigger instability, leading to the onset of convection long before reaching the Philippines. This "shortening" of the circulation towards the South American coasts generates a secondary vortex that moves surface air masses from the Philippines towards the central Pacific. This additional vortex also affects the water masses, dragging warm water from Oceania towards the South American coasts. As a result, the Humboldt Current is displaced, moving it away from the continent and raising the water temperature in front of the equatorial zone. The warming and weakening of the Ekman transport process caused by the Humboldt Current lead to a reduction in nutrient levels in the water and the migration and decline of marine populations.
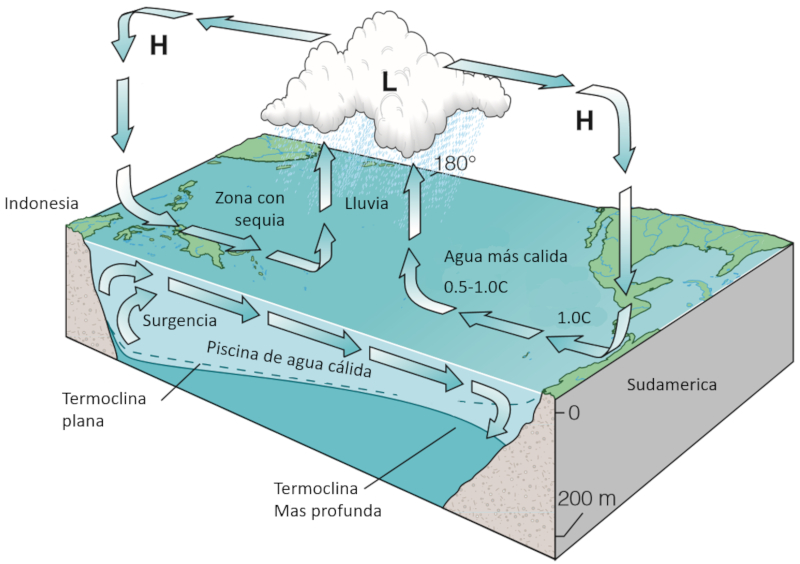
The described "drama" corresponds to what is known as the "El Niño" phenomenon, named as such because it typically occurs around Christmas time.
ID:(11749, 0)
South Pacific Oscillation (ENSO)
Description 
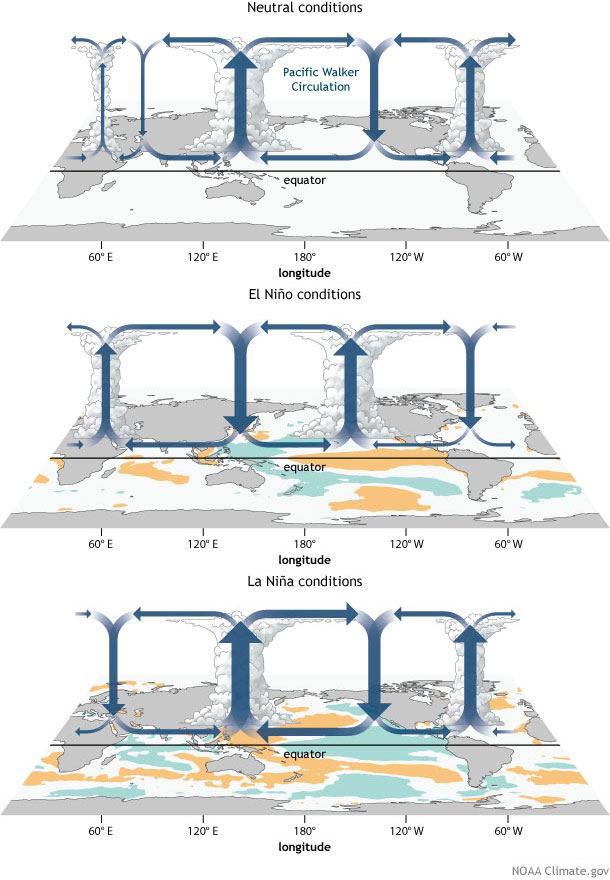
If we study the circulation that occurs under normal conditions and during the phenomenon of "El Niño," we discover that there is even an associated phenomenon that occurs primarily over the Indian Ocean and suppresses a downward current in that location. This happens due to a "normal" but more intense than usual situation, which, as a complement to "El Niño," is referred to as the phenomenon of "La Niña."
The phenomenon of "El Niño" was observed by different ship captains off the coast of Peru around 1800 and by the Englishman Charles Todd in 1888 when he analyzed climate data to understand why the monsoon did not occur in a particular year, leading to a severe famine in India. The phenomenon predates the industrial revolution, with evidence of its effects on Incan cultures and possibly being the cause of the disappearance of the Moche culture in Peru.
ID:(11750, 0)
The South Pacific Oscillation Index (SOI)
Equation 
To forecast the occurrence of the "El Niño" and "La Niña" phenomena, the average monthly pressure is measured in Darwin (Australia) and Tahiti. This is because one of the characteristics of these phenomena is the reversal of air flow between these regions. Therefore, if we have:
- High average pressure in Darwin and low average pressure in Tahiti, there is a flow of air from the Darwin region to the Tahiti region, which occurs in the case of "El Niño."
- Low average pressure in Darwin and high average pressure in Tahiti, there is a flow of air from the Tahiti region to the Darwin region, which occurs in the case of "La Niña."
This is shown in the following diagram:
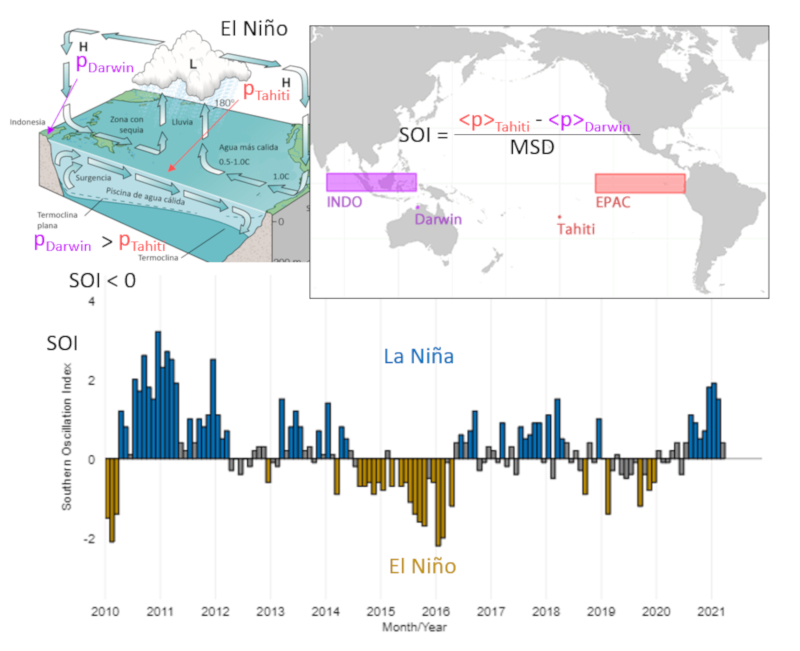
Therefore, the indicator of the Southern Oscillation is defined as:
| $ SOI =\displaystyle\frac{1}{ MSD_{Thaiti,Darwin} } ( \langle p \rangle_{Thaiti} - \langle p \rangle_{Darwin} )$ |
Southern Oscillation Data (SOI = Southern Oscillation Index):
The Long Paddock, Queensland Government
ID:(13212, 0)
Standardized pressure
Equation 
The standardized pressure anomaly is used to obtain a value with low fluctuations that allows for the display of pressure trends. The calculation takes the difference between the pressure value and the average value, and then divides it by the standard deviation of the values for a given month:
| $\langle p \rangle = \displaystyle\frac{p - \bar{p}}{\sigma_p}$ |
ID:(13213, 0)
Standardized deviation
Equation 
If we consider two locations, we can define a standardized difference by obtaining the daily standardized pressure at locations a and b, and then averaging the difference over the months considered.
ID:(13214, 0)
El Niño Effects
Description 
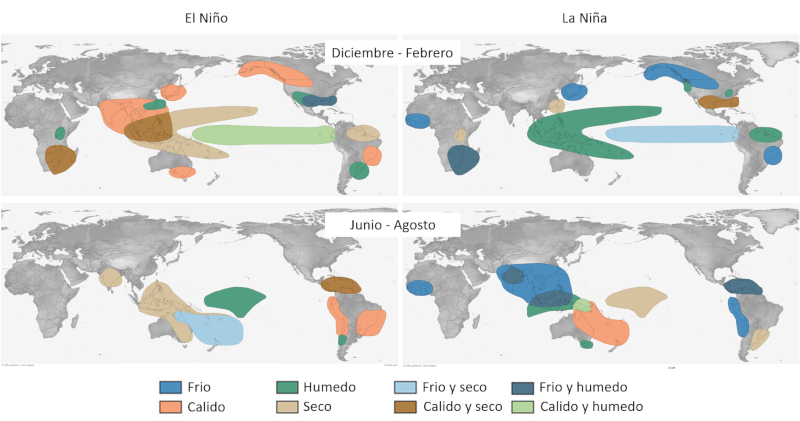
The Southern Oscillation of the Pacific, observed during the extreme conditions of El Niño and La Niña, leads to global fluctuations. In particular, there are areas that experience above-normal rainfall (WET) or below-normal rainfall (DRY). Generally, these areas are similar and alternate in sync with the Southern Oscillation of the Pacific.
ID:(11751, 0)
