Mostrar imágenes
Descripción 
Para mostrar un grupo de imágenes se puede definir la siguiente rutina:
import matplotlib.pyplot as plt

# routine to show 10 images in 20x20 format
def plotImages(images_arr):
    fig, axes = plt.subplots(1,10,figsize=(20,20))
    axes = axes.flatten()
    for img, ax in zip( images_arr, axes):
        ax.imshow(img)
        ax.axis('off')
    plt.tight_layout()
    plt.show()
ID:(13752, 0)
Mostrar imágenes y clasificación
Imagen 
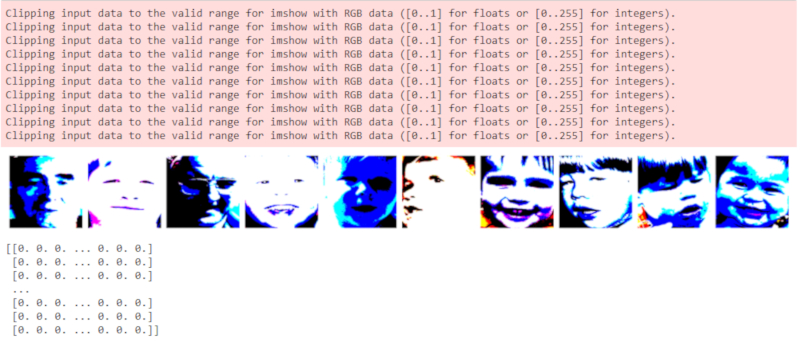
Se procede a mostrar las imágenes y listar la asignaciones asociadas (que en este caso por ser muchas no se alcanzan a ver):
plotImages(imgs)
print(labels)
El resultado tiene la forma:

Los colores han sido re-escalados para mejorar el contraste y normalizar los valores.
ID:(13754, 0)
Graficar función
Imagen 
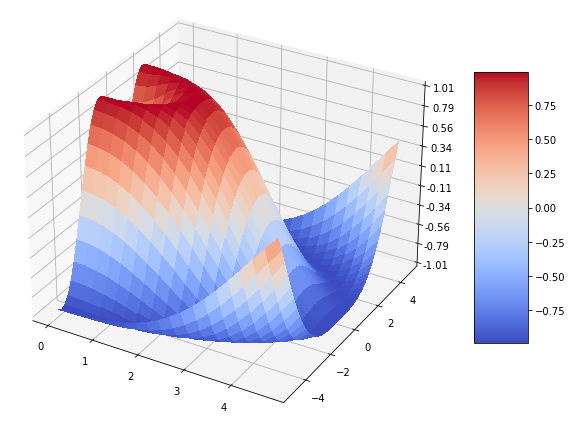
Usando la biblioteca matplotlib se puede graficar en 3D una función que se incluye directamente:
import matplotlib.pyplot as plt
from matplotlib import cm
from matplotlib.ticker import LinearLocator
import numpy as np

fig, ax = plt.subplots(subplot_kw={'projection': '3d'},figsize=(10,10))

# Make data.
X = np.arange(0, 5, 0.25)
Y = np.arange(-5, 5, 0.25)
X, Y = np.meshgrid(X, Y)
R = np.sqrt(X**2 + Y**2)
Z = np.sin(R)

# Plot the surface.
surf = ax.plot_surface(X, Y, Z, cmap=cm.coolwarm,
                       linewidth=0, antialiased=False)

# Customize the z axis.
ax.set_zlim(-1.01, 1.01)
ax.zaxis.set_major_locator(LinearLocator(10))
# A StrMethodFormatter is used automatically
ax.zaxis.set_major_formatter('{x:.02f}')

# Add a color bar which maps values to colors.
fig.colorbar(surf, shrink=0.5, aspect=5)

plt.show()
El ejemplo arroja:

ID:(14048, 0)
Graficar matriz
Imagen 
Usando la biblioteca matplotlib se puede graficar en 3D una función que se incluye directamente:
fig, ax = plt.subplots(subplot_kw={'projection': '3d'},figsize=(10,10))

# Make data.
X = np.arange(0, 5, 0.25)
Y = np.arange(-5, 5, 0.25)
Z = np.zeros((len(Y),len(X)))

i = 0
for x in X:
    j = 0
    for y in Y:
        Z[j][i] = np.sin(np.sqrt(x**2 + y**2))
        j = j + 1
    i = i + 1
X, Y = np.meshgrid(X, Y)

# Plot the surface.
surf = ax.plot_surface(X, Y, Z, cmap=cm.coolwarm,
                       linewidth=0, antialiased=False)

# Customize the z axis.
ax.set_zlim(-1.01, 1.01)
ax.zaxis.set_major_locator(LinearLocator(10))
# A StrMethodFormatter is used automatically
ax.zaxis.set_major_formatter('{x:.02f}')

# Add a color bar which maps values to colors.
fig.colorbar(surf, shrink=0.5, aspect=5)

plt.show()
El ejemplo arroja:

ID:(14049, 0)
