Bilder anzeigen
Beschreibung 
Um eine Gruppe von Bildern zu zeigen, kann die folgende Routine definiert werden:
import matplotlib.pyplot as plt

# routine to show 10 images in 20x20 format
def plotImages(images_arr):
    fig, axes = plt.subplots(1,10,figsize=(20,20))
    axes = axes.flatten()
    for img, ax in zip( images_arr, axes):
        ax.imshow(img)
        ax.axis('off')
    plt.tight_layout()
    plt.show()
ID:(13752, 0)
Bilder und Klassifizierung anzeigen
Bild 
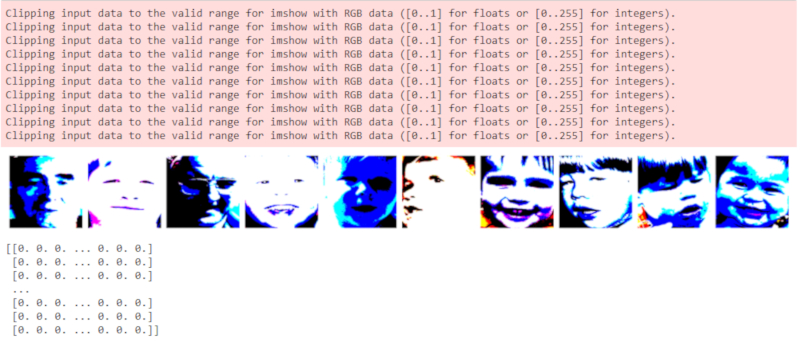
Wir zeigen nun die Bilder und listen die zugehörigen Zuordnungen auf (die in diesem Fall, da viele, nicht zu sehen sind):
plotImages(imgs)
print(labels)
Die Farben wurden neu skaliert, um den Kontrast zu verbessern und die Werte zu normalisieren.
Das Ergebnis hat die Form:

ID:(13754, 0)
Funktionen darstellen
Bild 
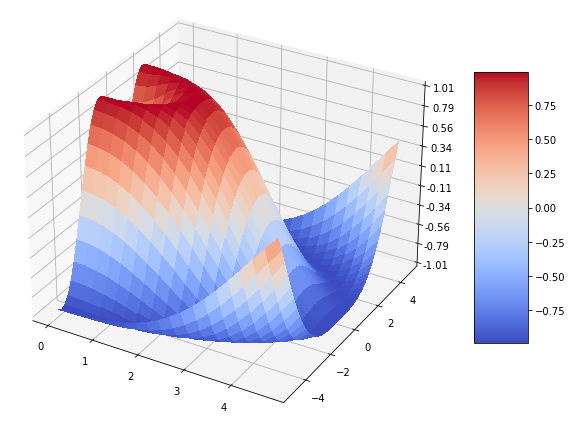
Mit der Matplotlib-Bibliothek können Sie eine Funktion in 3D plotten, die direkt enthalten ist:
import matplotlib.pyplot as plt
from matplotlib import cm
from matplotlib.ticker import LinearLocator
import numpy as np

fig, ax = plt.subplots(subplot_kw={'projection': '3d'},figsize=(10,10))

# Make data.
X = np.arange(0, 5, 0.25)
Y = np.arange(-5, 5, 0.25)
X, Y = np.meshgrid(X, Y)
R = np.sqrt(X**2 + Y**2)
Z = np.sin(R)

# Plot the surface.
surf = ax.plot_surface(X, Y, Z, cmap=cm.coolwarm,
                       linewidth=0, antialiased=False)

# Customize the z axis.
ax.set_zlim(-1.01, 1.01)
ax.zaxis.set_major_locator(LinearLocator(10))
# A StrMethodFormatter is used automatically
ax.zaxis.set_major_formatter('{x:.02f}')

# Add a color bar which maps values to colors.
fig.colorbar(surf, shrink=0.5, aspect=5)

plt.show()
Das Beispiel ergibt:

ID:(14048, 0)
Matrix darstellen
Bild 
Mit der Matplotlib-Bibliothek können Sie eine Funktion in 3D plotten, die direkt enthalten ist:
fig, ax = plt.subplots(subplot_kw={'projection': '3d'},figsize=(10,10))

# Make data.
X = np.arange(0, 5, 0.25)
Y = np.arange(-5, 5, 0.25)
Z = np.zeros((len(Y),len(X)))

i = 0
for x in X:
    j = 0
    for y in Y:
        Z[j][i] = np.sin(np.sqrt(x**2 + y**2))
        j = j + 1
    i = i + 1
X, Y = np.meshgrid(X, Y)

# Plot the surface.
surf = ax.plot_surface(X, Y, Z, cmap=cm.coolwarm,
                       linewidth=0, antialiased=False)

# Customize the z axis.
ax.set_zlim(-1.01, 1.01)
ax.zaxis.set_major_locator(LinearLocator(10))
# A StrMethodFormatter is used automatically
ax.zaxis.set_major_formatter('{x:.02f}')

# Add a color bar which maps values to colors.
fig.colorbar(surf, shrink=0.5, aspect=5)

plt.show()
Das Beispiel ergibt:

ID:(14049, 0)
