Training Absolute Temperature
Storyboard 
By means of Charles's law, the temperature of absolute zero can be estimated. For this a volume of gas is contracted at 100C at 0C and with both volumes and temperatures it is possible by Charles's law to estimate absolute zero.
ID:(1478, 0)
Experiment to estimate absolute zero
Description
If the volume of a gas is measured at 0°C and 100°C, a linear behavior can be observed on the volume-temperature graph. If the line is projected, it can be seen that at some point of negative temperatures (in Celsius or Fahrenheit scale), the volume will reach zero. This point is called absolute zero.
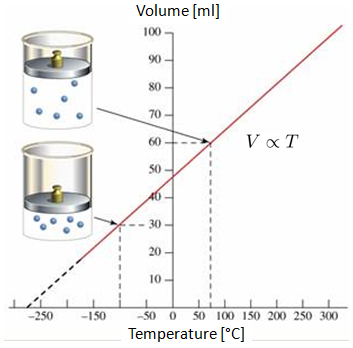
It is important to note that in reality, the situation where the volume reaches zero is not attainable, as all gases condense and solidify long before reaching absolute zero.
ID:(11169, 0)
Practical: Absolute temperature
Description
In the following video, you can see how gas volumes at different temperatures are determined in the laboratory in order to plot the volume-temperature curve at constant pressure. The intersection of the line with the temperature axis determines the absolute temperature at which, theoretically, the volume should be zero:
The obtained values are:
| V [ml] | T [C] |
| 152.1 | 3.7 |
| 165.1 | 21.9 |
| 183.1 | 43.0 |
which are graphically represented, including the line calculated by regression:
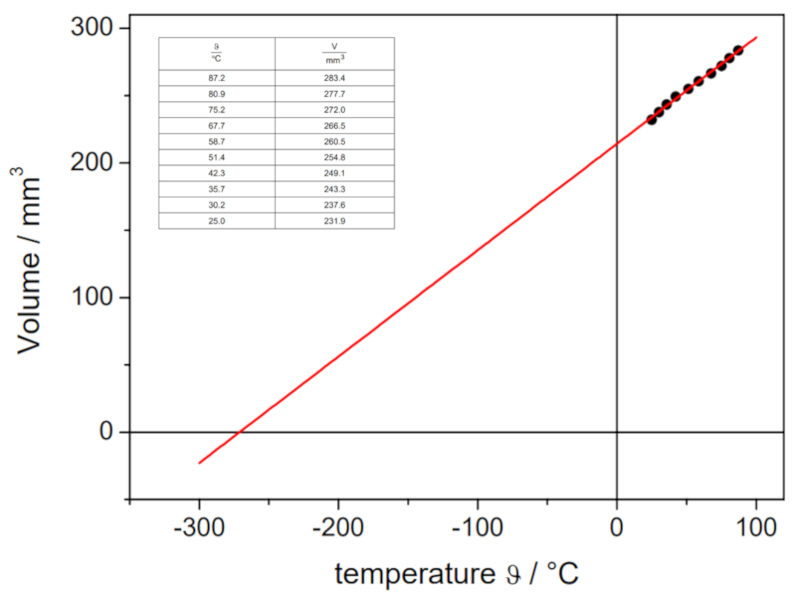
This estimation yields a value of -148°C, which differs from the actual value of -273.15°C.
ID:(11173, 0)
Training Absolute Temperature
Model
By means of Charles's law, the temperature of absolute zero can be estimated. For this a volume of gas is contracted at 100C at 0C and with both volumes and temperatures it is possible by Charles's law to estimate absolute zero.
Variables
Calculations
Calculations
Equations
Charles's law states that, with the pressure ($p$) constant, the ratio of the volume ($V$) to the absolute temperature ($T$) equals the charles law constant ($C_c$):
| $\displaystyle\frac{ V }{ T } = C_c$ |
This implies that if a gas transitions from an initial state (the volume in state i ($V_i$) and the temperature in initial state ($T_i$)) to a final state (the volume in state f ($V_f$) and the temperature in final state ($T_f$)), while keeping the pressure ($p$) constant, it must always comply with Charles's law:
$\displaystyle\frac{V_i}{T_i} = C_c = \displaystyle\frac{V_f}{T_f}$
Therefore, we have:
| $\displaystyle\frac{ V_i }{ T_i }=\displaystyle\frac{ V_f }{ T_f }$ |
(ID 3492)
Examples
(ID 15261)
If the volume of a gas is measured at 0 C and 100 C, a linear behavior can be observed on the volume-temperature graph. If the line is projected, it can be seen that at some point of negative temperatures (in Celsius or Fahrenheit scale), the volume will reach zero. This point is called absolute zero.
It is important to note that in reality, the situation where the volume reaches zero is not attainable, as all gases condense and solidify long before reaching absolute zero.
(ID 11169)
In the following video, you can see how gas volumes at different temperatures are determined in the laboratory in order to plot the volume-temperature curve at constant pressure. The intersection of the line with the temperature axis determines the absolute temperature at which, theoretically, the volume should be zero:
The obtained values are:
| V [ml] | T [C] |
| 152.1 | 3.7 |
| 165.1 | 21.9 |
| 183.1 | 43.0 |
which are graphically represented, including the line calculated by regression:
This estimation yields a value of -148 C, which differs from the actual value of -273.15 C.
(ID 11173)
(ID 15320)
ID:(1478, 0)