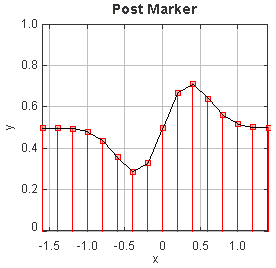
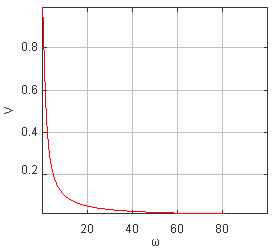
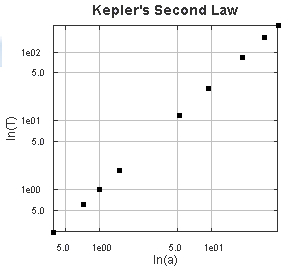
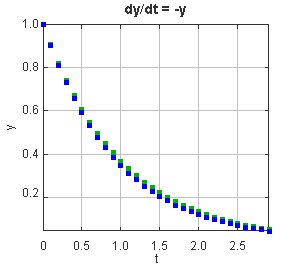
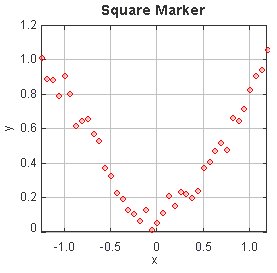
Gráfica XY con Marcadores y Ejes
Imagen 
Curva simple con marcadores:
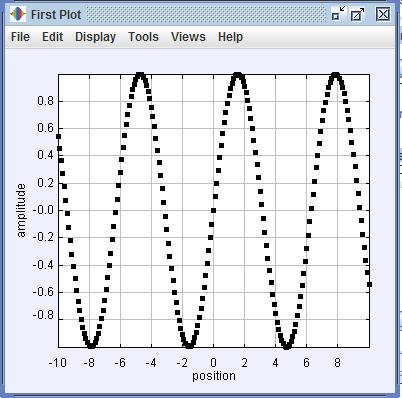
Código:
```
/*
http://www.opensourcephysics.org/
@author W. Christian
*/
import org.opensourcephysics.frames.*;
import javax.swing.JFrame;
public class FirstPlotApp {
public static void main(String[] args) {
PlotFrame frame = new PlotFrame("position", "amplitude", "First Plot");
frame.setSize(400, 400);
for(double x = -10, dx = 0.1;x<10;x += dx) {
frame.append(0, x, Math.sin(x));
}
frame.setVisible(true);
frame.setDefaultCloseOperation(JFrame.EXIT_ON_CLOSE);
}
}
```
ID:(1806, 0)
Connected Line, Curva y Ejes
Imagen 
Curva simple con marcadores:
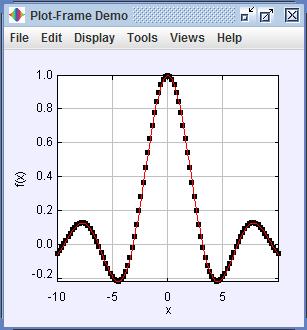
Código:
```
/*
http://www.opensourcephysics.org/
@author W. Christian
*/
public class PlotFrameApp {
public static void main(String[] args) {
PlotFrame frame = new PlotFrame("x", "f(x)", "Plot-Frame Demo");
frame.setConnected(true); // sets default to connect dataset points
frame.setXYColumnNames(0, "x", "sin(x)/x"); // sets nammes for first dataset
double dx = 0.2;
for(double x = -10;x<=10;x += dx) {
frame.append(0, x, Math.sin(x)/x);
}
frame.setVisible(true);
frame.setDefaultCloseOperation(JFrame.EXIT_ON_CLOSE);
}
}
```
ID:(2415, 0)
Área Marker, Curva y Áreas Marcadas
Imagen 
Curva con areas bajo la curva:
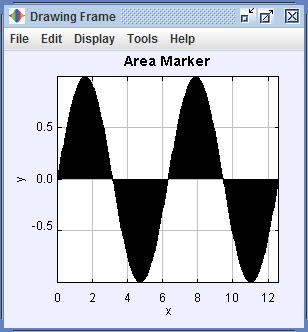
Código:
```
/*
http://www.opensourcephysics.org/
@author W. Christian
*/
public class MarkerAreaApp {
public static void main(String[] args) {
PlottingPanel panel = new PlottingPanel("x", "y", "Area Marker");
DrawingFrame frame = new DrawingFrame(panel);
panel.setSquareAspect(false);
panel.setAutoscaleX(true);
panel.setAutoscaleY(true);
Dataset dataset = new Dataset();
dataset.setMarkerShape(Dataset.AREA);
dataset.setConnected(true);
for(int i = 0;i<200;i++) {
double x = 4*Math.PI*i/(199);
dataset.append(x, Math.sin(x));
}
panel.addDrawable(dataset);
org.opensourcephysics.display.GUIUtils.showDrawingAndTableFrames();
frame.setDefaultCloseOperation(JFrame.EXIT_ON_CLOSE);
frame.setVisible(true);
}
}
```
ID:(1807, 0)
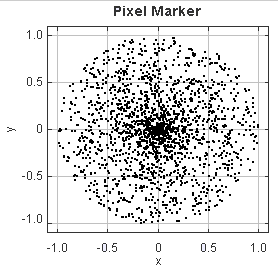
Pixel Marker, Pixeles en un Sistema de Coordenadas
Imagen 
Propiedades de los Marcadores
ID:(2416, 0)

