Changes in the atmosphere
Storyboard 
The possible changes in the atmosphere are varied and range from changes in the type of cloudiness, which affects atmospheric albedo, to variations in coverage. In the visible range this is primarily the formation of more clouds or the evaporation of these. In the infrared range, which is especially associated with greenhouse gases, infrared coverage varies.
ID:(576, 0)
Visible coverage (clouds)
Definition 
On average, clouds cover more than 40% of the Earth\'s surface:

As they are visible, clouds reflect light, resulting in visible radiation and are associated with atmospheric albedo.
ID:(3071, 0)
Atmospheric albedos according to cloud type
Image 
Las principales nubes y los rangos de altura y albedo se indican en la siguiente tabla:
Cumulus (Cu) 11.49% | Stratocumulus (Sc) 12.07% | Stratus (St) 1.76% | |
| Grosor optico | 0.0-3.6 | 3.6-23 | 23-379 |
ID:(7532, 0)
How greenhouse gases work
Exercise 
The atmosphere contains various gases that can absorb the radiation passing through it. In the visible range, it is primarily water vapor, and in the infrared range, it is carbon dioxide ($CO_2$), methane ($CH_4$), and nitrous oxide ($N_2O$).
This can be visualized graphically through spectra. The yellow line represents the spectrum as it is emitted: at the top, by the sun (visible) and by the earth (infrared). The red line shows what remains of the spectrum once it has passed through the atmosphere, clearly highlighting the frequencies that do not pass through due to absorption:

ID:(10844, 0)
Radiation absorption by the atmosphere
Equation 
On a molecular level, molecules can oscillate with frequencies that depend on their geometry. This means that if radiation passes through a gas of molecules and its frequency is similar to one of the natural frequencies of the molecules, it will be absorbed by the gas. As a result, a portion of the radiation that traverses the atmosphere is retained, giving rise to the observed coverage in climate models.
Here is a historical video (from 1960) showing how molecules vibrate according to their geometry:
Description of the video on YouTube:
The Chemical Educational Materials Study, better known as the CHEM Study, was developed in the early 1960s at UC Berkeley\'s College of Chemistry, Lawrence Hall of Science, and Harvey Mudd College, and continued at Lawrence Hall of Science until the 1980s. The textbook was written by Glenn T. Seaborg in the early 1960s.
ID:(7330, 0)
Radiative forcing of the main gases
Script 
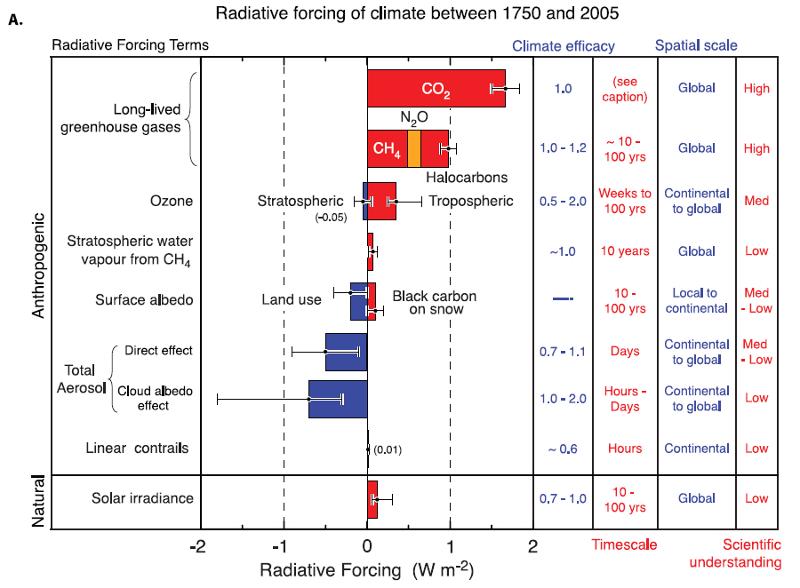
The diagram shows the radiative forcing of the main gases in the atmosphere:

This diagram illustrates the relative contribution of different gases to the radiative forcing of the atmosphere. Each gas has its own impact on the warming or cooling of the climate system.
Some gases, such as carbon dioxide (CO2) and methane (CH4), are greenhouse gases that trap heat in the atmosphere and contribute to global warming. Other gases, such as nitrous oxide (N2O), also have a warming effect.
On the other hand, some gases, like sulfur dioxide (SO2) and sulfate aerosols, have a cooling effect by reflecting solar radiation and reducing the amount of energy that reaches the Earth\'s surface.
Understanding the relative importance of these gases in radiative forcing is crucial for assessing their impact on climate change and for developing effective mitigation strategies.
ID:(7325, 0)
Radiative forcing of other gases and aerosols
Variable 
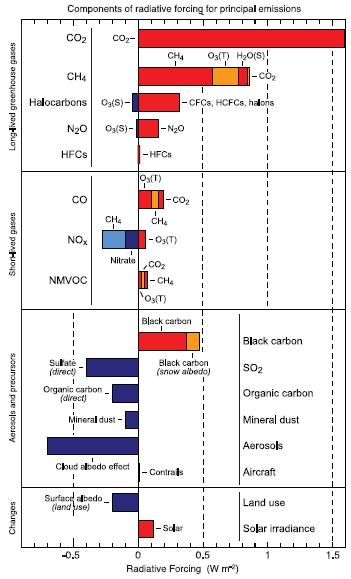
The graph displays the radiative forcing of other gases and aerosols. Some of them contribute to cooling the planet:

These radiative forcings represent the influence of different gases and aerosols on Earth\'s energy balance. Some gases, such as sulfur dioxide (SO2) and sulfate aerosols, have cooling effects by reflecting solar radiation and reducing the amount of radiation reaching the Earth\'s surface.
Understanding the contribution of these gases and aerosols to the global radiative balance is important, as they have significant implications for climate and can influence climate patterns and global warming. Studying and assessing their impact allows us to take appropriate measures to address climate change and seek sustainable solutions.
ID:(7326, 0)
Radiative forcing over time
Audio 
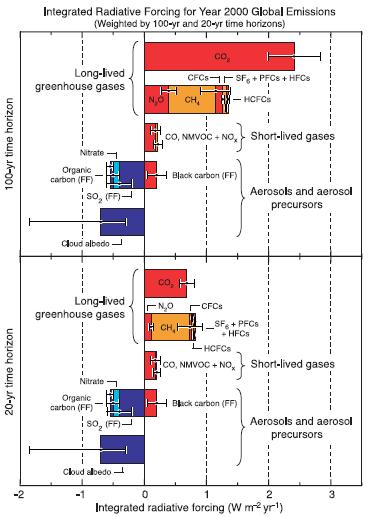
The graph displays the projected radiative forcings expected in the 20-year and 100-year horizons:

These projections represent potential scenarios of radiative forcings in the near and distant future. It is important to note that these projections are based on current scientific models and assumptions and are subject to uncertainties.
Analyzing radiative forcings in the long term is crucial for understanding potential impacts on climate and global warming. These findings can help inform policies and actions aimed at mitigating the effects of climate change and promoting environmental sustainability.
ID:(7327, 0)
Changes in the atmosphere
Video 
A situation that illustrates the impact of coverage on climate occurred during the three-day ban on commercial flights following the attack on the Twin Towers. The absence of commercial flights for 72 hours led to a decrease in condensation trails (contrails), which in turn resulted in a change in cloud cover and a reduction in cirrus clouds.
ID:(9247, 0)
Changes in the atmosphere
Storyboard 
The possible changes in the atmosphere are varied and range from changes in the type of cloudiness, which affects atmospheric albedo, to variations in coverage. In the visible range this is primarily the formation of more clouds or the evaporation of these. In the infrared range, which is especially associated with greenhouse gases, infrared coverage varies.
Variables
Calculations
Calculations
Equations
Examples
On average, clouds cover more than 40% of the Earth\'s surface:
As they are visible, clouds reflect light, resulting in visible radiation and are associated with atmospheric albedo.
Las principales nubes y los rangos de altura y albedo se indican en la siguiente tabla:
Cumulus (Cu) 11.49% | Stratocumulus (Sc) 12.07% | Stratus (St) 1.76% | |
| Grosor optico | 0.0-3.6 | 3.6-23 | 23-379 |
To estimate the future albedo of the atmosphere $a_a$, the current albedo is added to the variation $\delta a_a$:
Las superficies total de las nubes $S_i$ se obtiene de las suma de las superficies individuales
$S_c=\sum_iS_i$
Tambi n aqu el albedo total es la suma ponderada de los albedos de las distintas zonas de la superficie seg n el tipo de nubosidad que exista. Por ello se tiene que
$a_a =\displaystyle\frac{\sum_is_ia_{a,i}}{\sum_is_i}$
La variaci n de la superficies total de las nubes debe ser nula si la superficie se conserva:
$\sum_i\delta S_{e,i}=0$
Tambi n aqu el albedo total es la suma ponderada de los albedos de las distintas zonas de la superficie seg n el tipo de nubosidad que exista. Por ello se tiene que
aa =
P
Pi siaa;i
i si
y en forma an loga la variaci n del albedo es
x0eaa =
P
Pi x0esiaa;i
i si
Similarly, variations in the coverage factors $\gamma_v$ should also be considered:
The change can be due to variations in water vapor and, consequently, cloudiness. Therefore, the amount and distribution of clouds in the atmosphere can vary, which affects the amount of solar radiation reaching the Earth\'s surface. A higher visible coverage factor indicates a greater presence of clouds, which can reduce the amount of direct solar radiation and impact the Earth\'s energy balance.
Visible cloudiness plays a significant role in the climate system by influencing heat distribution and precipitation formation. By considering these variations in the coverage factors, we can obtain a more comprehensive understanding of how solar radiation interacts with the atmosphere and Earth\'s surface, and how it affects climate and weather patterns.
The visible coverage is largely determined by the ratio between the surface covered by clouds $S_c$ and the total surface area of the planet $S_t$:
which is around 42% on Earth.
To estimate the variation in visible coverage, a first-order approximation can assume a linear relationship with the variation in moles of water in the atmosphere due to temperature increase:
The atmosphere contains various gases that can absorb the radiation passing through it. In the visible range, it is primarily water vapor, and in the infrared range, it is carbon dioxide ($CO_2$), methane ($CH_4$), and nitrous oxide ($N_2O$).
This can be visualized graphically through spectra. The yellow line represents the spectrum as it is emitted: at the top, by the sun (visible) and by the earth (infrared). The red line shows what remains of the spectrum once it has passed through the atmosphere, clearly highlighting the frequencies that do not pass through due to absorption:
On a molecular level, molecules can oscillate with frequencies that depend on their geometry. This means that if radiation passes through a gas of molecules and its frequency is similar to one of the natural frequencies of the molecules, it will be absorbed by the gas. As a result, a portion of the radiation that traverses the atmosphere is retained, giving rise to the observed coverage in climate models.
Here is a historical video (from 1960) showing how molecules vibrate according to their geometry:
Description of the video on YouTube:
The Chemical Educational Materials Study, better known as the CHEM Study, was developed in the early 1960s at UC Berkeley\'s College of Chemistry, Lawrence Hall of Science, and Harvey Mudd College, and continued at Lawrence Hall of Science until the 1980s. The textbook was written by Glenn T. Seaborg in the early 1960s.
Similarly, variations in the infrared coverage factors $\gamma_i$ should also be considered:
The variation in infrared coverage is primarily due to changes in greenhouse gases and water vapor, which result from environmental fluctuations. These changes can be the result of natural climate variations and/or human actions.
Greenhouse gases, such as carbon dioxide (CO2), methane (CH4), and nitrous oxide (N2O), have the ability to absorb and emit infrared radiation, contributing to the greenhouse effect and global warming. Human activities, such as burning fossil fuels and deforestation, can increase the concentration of these gases in the atmosphere and thus affect infrared coverage.
Studying and understanding these variations in infrared coverage factors is important to assess their impact on climate and Earth\'s energy balance. This enables us to take appropriate measures to mitigate the effects of climate change and promote sustainable practices.
The variation in the infrared (IR) coverage factor is associated with changes in greenhouse gases. These are measured in ppm (parts per million) and ppb (parts per billion) and are calculated based on the gas density $\rho$ in the air using the following equations:
$ppmv =\displaystyle\frac{gas}{10^6 air}=\displaystyle\frac{V_n}{M_g}\displaystyle\frac{10^{-6}g,gas}{l,air}$
and
$ppbv =\displaystyle\frac{gas}{10^9 air}=\displaystyle\frac{V_n}{M_g}\displaystyle\frac{10^{-9}g,gas}{l,air}$
where $M_g$ is the molar mass of the gas and $V_n$ is the volume under standard conditions (temperature $0^{\circ}C$, pressure $10^5,Pa$ which is $22.71108,l$).
As an example, if we consider the current level of $CO_2$ (molar mass $44.0 g/mol$), we can see that the concentration of $379 ppmv$ (2005) corresponds to $0.736 g/l CO_2$. To determine the total amount of $CO_2$ in the atmosphere, we need to know the total volume of air. Since the atmospheric layer is theoretically infinite (becoming increasingly diluted but still present), defining the height of the air layer poses a challenge. However, if we consider that, according to the barometric law, pressure decreases as
$p(z) = p_0 e^{M_agz/RT}$
we have a similar relationship for density
$\rho(z) = \rho_0 e^{M_ag z/RT}$
If we integrate this equation with respect to z, we will find that the amount is such that all the air would be concentrated with surface density in a layer of height
$z_0 =\displaystyle\frac{RT}{M_ag}= 8001.78m$
at zero temperature. In other words, the total volume of $CO_2$ in the atmosphere can be calculated by multiplying the estimated density by the volume of a layer 8001.78 m high that extends across the entire planet. Assuming a radius of the Earth of $6370 km$ and a density of $0.736e-3,g/l$, the calculated mass of $CO_2$ in the layer of height 8001.78 m is 3000 Gt $CO_2$.
Since the molar mass of carbon (C) is 12 g/mol and that of $CO_2$ is $44.1 g/mol$, the mass of carbon in the atmosphere is $3000\cdot 12/44.1$, which equals 817 Gt C. The relationship between concentration and radiative forcing can be obtained from the table on the next page. The information regarding scenarios indicates the amount of gases added to the atmosphere annually. In general, radiative forcing (FR) is related to the variation in temperature in the atmosphere with
$\Delta T = \delta T_b - \delta T_t$
is
where $\lambda$ is the climate sensitivity corresponding to $0.8 Km^2/W$. For the case of $CO_2$, we can consider a 13 ppm increase and a radiative forcing of 1.66 W/m^2.
To obtain the total infrared coverage (NIR), denoted as $\delta\gamma_i$, the contributions of each gas must be summed:
where $\alpha_{ij}$ represents the contribution of gas $j$ to the infrared coverage of gas $i$. The sum is performed over all relevant gases.
Therefore, the variation in the total infrared coverage can be calculated using:
This equation provides the relative difference between the final and initial values of the infrared coverage.
It\'s important to note that these equations are a simplified representation of the processes involved in calculating the total infrared coverage and its variation. The actual calculations may consider additional factors and complexities specific to the system or scenario being analyzed.
The radiative forcing $\Delta F_k$ for greenhouse gas $k$ contributes based on the incoming radiation to the planet, which is equal to the solar insolation intensity $I_s$ multiplied by $(1-a_a)$, where $a_a$ is the atmospheric albedo.
By increasing the concentration $c_k$ by an amount $\delta c_k$, the increase in the flux incident from the atmosphere is given by:
The diagram shows the radiative forcing of the main gases in the atmosphere:
This diagram illustrates the relative contribution of different gases to the radiative forcing of the atmosphere. Each gas has its own impact on the warming or cooling of the climate system.
Some gases, such as carbon dioxide (CO2) and methane (CH4), are greenhouse gases that trap heat in the atmosphere and contribute to global warming. Other gases, such as nitrous oxide (N2O), also have a warming effect.
On the other hand, some gases, like sulfur dioxide (SO2) and sulfate aerosols, have a cooling effect by reflecting solar radiation and reducing the amount of energy that reaches the Earth\'s surface.
Understanding the relative importance of these gases in radiative forcing is crucial for assessing their impact on climate change and for developing effective mitigation strategies.
The graph displays the radiative forcing of other gases and aerosols. Some of them contribute to cooling the planet:
These radiative forcings represent the influence of different gases and aerosols on Earth\'s energy balance. Some gases, such as sulfur dioxide (SO2) and sulfate aerosols, have cooling effects by reflecting solar radiation and reducing the amount of radiation reaching the Earth\'s surface.
Understanding the contribution of these gases and aerosols to the global radiative balance is important, as they have significant implications for climate and can influence climate patterns and global warming. Studying and assessing their impact allows us to take appropriate measures to address climate change and seek sustainable solutions.
The graph displays the projected radiative forcings expected in the 20-year and 100-year horizons:
These projections represent potential scenarios of radiative forcings in the near and distant future. It is important to note that these projections are based on current scientific models and assumptions and are subject to uncertainties.
Analyzing radiative forcings in the long term is crucial for understanding potential impacts on climate and global warming. These findings can help inform policies and actions aimed at mitigating the effects of climate change and promoting environmental sustainability.
A situation that illustrates the impact of coverage on climate occurred during the three-day ban on commercial flights following the attack on the Twin Towers. The absence of commercial flights for 72 hours led to a decrease in condensation trails (contrails), which in turn resulted in a change in cloud cover and a reduction in cirrus clouds.
ID:(576, 0)
