
Problemática
Storyboard
ID:(1031, 0)
Diagrama de la Discusión
Imagen

fbarros002
ID:(8379, 0)
Diagrama Capilares
Imagen
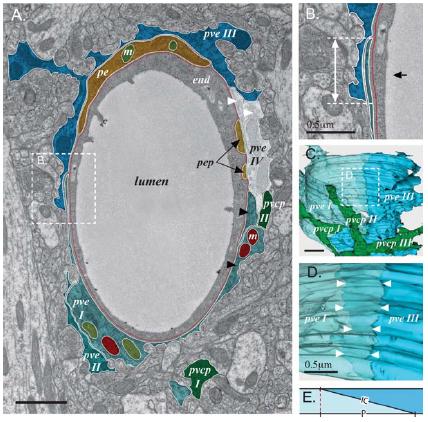
Del articulo The Perivascular Astroglial Sheath Provides a Complete Covering of the Brain Microvessels: An Electron Microscopic 3D Reconstruction, Thomas Misje Mathiisen, Knut Petter Lehre, Niels Christian Danbold, and Ole Petter Ottersen, GLIA 58:1094–1103 (2010), imagen 5 se tiene que:
Variable|Valor
------------|----------
Radio del Lumen|10 um
Ancho Endotelio|0.2 um (1 um?)
Ancho Membrana Basal|20 nm=0.02 um
Ancho Astrocito|0.2 um
Largo del canal por Astrocito|0.7 um
Ancho del canal por Astrocito|20 nm=0.02 um
Concentración de Glucosa entre Astrocito y Neurona|1mM
Datos geométricos obtenidos del diagrama:
El transporte de glucosa se realiza por los GluT (Glucose transport protein).
### GluT
En endotelio y astrocito se tienen Glut del tipo 1, en la neurona del tipo 3.
Proteina | Km | Substance
------------|--------------|----------------
GluT1 | 20-21 mM | 3-O-methylglucose
" | 5 mM | 2-deoxy-D-glucose
" | 3 mM | Glucose
" | ? | Calactose, mannose and glucosamine
GluT3 | 1.4 mM | Glucose (2-deoxy-glucose)
" | 8.5 mM | Galactose
" | ? | Mannose, maltose, xylose and dehy-droascorbic acid
Functional Properties and Genomics of Glucose Transporters, Feng-Qi Zhao and Aileen F Keating, Curr Genomics. 2007 Apr; 8(2): 113–128, https://www.ncbi.nlm.nih.gov/pmc/articles/PMC2435356/
Tanto el GluT1 como el GluT3 realizan entre 200 y 1000 translocaciones por segundo (FB).
Brain Glucose Transporters: Relationship to Local Energy Demand, Roman Duelli and Wolfgang Kuschinsky, News Physiol. Sci., Volume 16, April 2001, 71-76
Membranes|Concentration ($1/\mu m^2$)
-----------------|-----------------------------------------
Endothelial|4.4
Atrocyte/Basal laminar|1.2
Abluminal/Neuron|0.9
Interictal Seizure Resections Show Two Configurations of Endothelial Glut! Glucose Transporter in the Human
Blood-Brain Barrier, Eain M. Cornford, Shigeyo Hyman, Marcia E. Cornford, JIElliot M. Landaw, and Antonio V. Delgado-Escueta, J Cereb Blood Flow Metab. Vol. 18, No.1, 1998
Localization of Brain Endothelial Luminal and Abluminal
Transporters with Immunogold Electron Microscopy
Eain M. Cornford and Shigeyo Hyman, The Journal of the American Society for Experimental NeuroTherapeutics, Vol. 2, 27–43, January 2005
### Unidades
Km (en $1,mM = 1,milimolar = 1,mol/m^3$) es la constante de afinidad, o sea la concentración en que esta a 50% de estar saturado.
ID:(8378, 0)
Location of the different glucose transporter
Imagen
Location of the different glucose transporter:
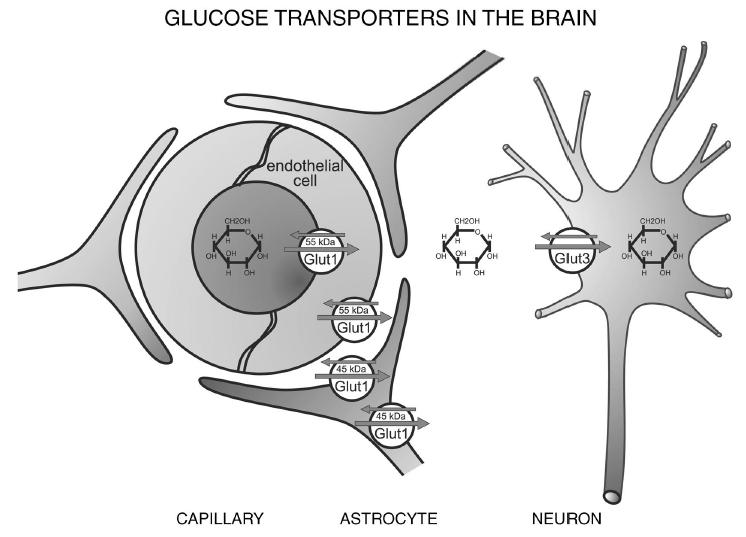
Location of the different glucose transporter isoforms in the brain. Glut1 is abundant in its 55-kDa isoform in the endothelial cells, whereas the 45-kDa isoform is expressed in astrocytes. Glut3 is the neuronal glucose transporter. Only traces of other Glut isoforms are found in the brain; of these, Glut4 has been detected in distinct neuronal populations and Glut5 in microglia.
(News Physiol. Sci., Volume 16, April 2001)
ID:(8910, 0)
Cellular distribution of Glut1
Imagen
Cellular distribution of Glut1:
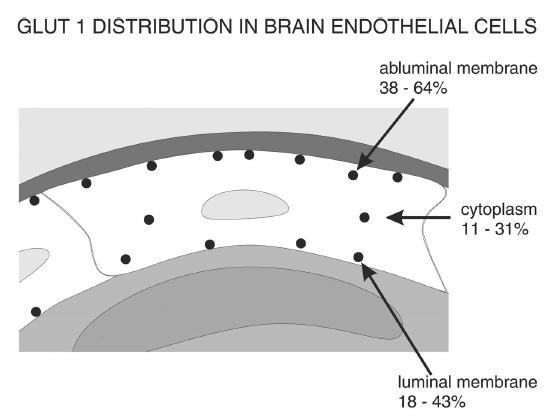
Cellular distribution of Glut1 in the luminal and abluminal membranes of brain endothelial cells. Although differences exist between species, the smallest fraction of Glut1 is generally found in the cytoplasm and the largest fraction at the abluminal membrane. The lower Glut1 content at the luminal membrane may be due to the comparably high glucose concentration at this membrane, which is close to the plasma concentration.
(News Physiol. Sci., Volume 16, April 2001)
ID:(8911, 0)
Type A capillary profile double stained
Imagen
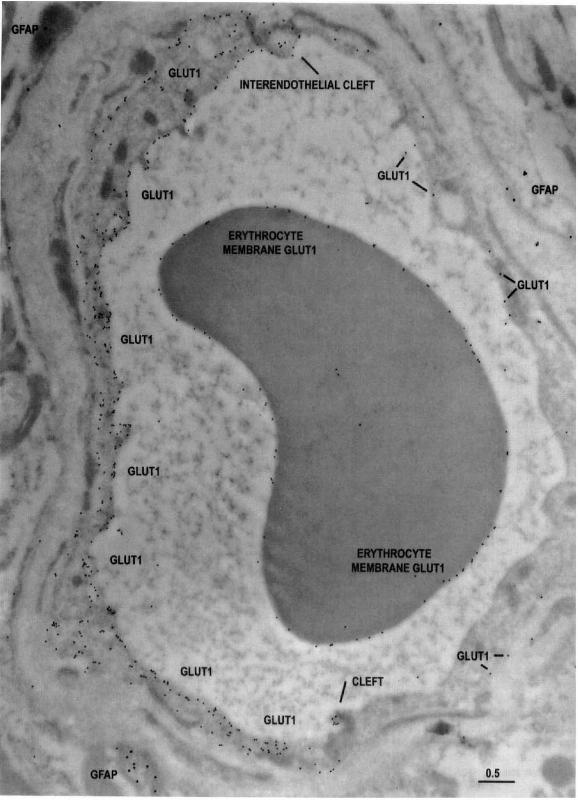
Type A capillary profile double stained:
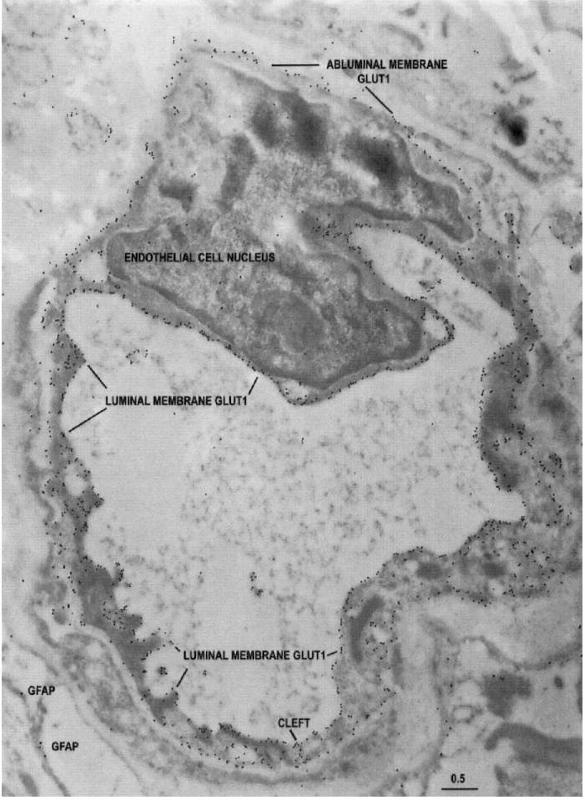
The typical appearance of an entirely reactive type A capillary profile double stained with 10-nm-immunogold-Glut1 and 20-nmimmunogold-Iabeled G FAP (glial fibrillary acidic protein) from the less actively spiking area of a temporal lobe seizure resection. Note that the Glut1 glucose transporter immunogold epitopes can be seen around the entire capillary circumference. The Glut1 glucose transporter protein is abundant on both luminal and abluminal endothelial membranes, and also at the interendothelial cleft. Only a few G FAP epitopes (20-nm gold particles) are apparent. Scale bar = 0.5 um.
(J Cereh Blood Flow Metab, Vol. 18, No.1, 1998)
ID:(8912, 0)
Analysis of Type A
Descripción
TABLE 1. Analyses of Type A (entirely-reactive) capillaries: Endothelial cell parameters in the interictal state
Parameter | Case 1 | | Case 2 | | Case 3 | | Case 4 | | Case 5 |
----------|--------|------|--------|------|--------|------|--------|------|--------|------
- | More active | Less active | More active | Less active | More active | Less active | More active | Less active | More active | Less active
- | EEG site | EEG site | EEG site | EEG site | EEG site | EEG site | EEG site | EEG site | EEG site | EEG site
Abluminal Membrane Length um|22.9±6.4|23.8±9.3|25.6±7.0|24.3±7.1|25.3±9.4|21.5±6.4|22.8±6.5|19.5±6.2|25.9±7.4|3l.l±21.6
Luminal Membrane Length um|21.4±6.6|22.7±8.9|24.4±8.0|23.9±7.7|20.7±6.9|18.6±5.8|18.5±4.0|16.2±4.7|22.5±8.7|25.4±20.3
Net Cytoplasmic Area (um2)|7.0±2.9|7.3±3.4|7.2±2.3|6.7±2.8|8.3±5.4|6.1±3.1|9.8±5.1|7.2±3.1|1l.l±4.0|2.8±9.9
Area of Capillary Lumen (um2)|15.2±6.7|17.2±14.0|21.4±12.0|19.3±14.9|16.3±8.7|11.9±6.9|12.8±5.9|10.6±6.1|18.4±8.3|12.1±9.2
Endothelial Cell Thickness nm|402±67|289±89|300±52|326±70|337±47|307±52|497±88|477±46|477±75|670±218
Basal LaminaiPericyte Area (um2)|15.6±10.4|10.4±7.2|8.0±3.9|11.9±10.9|10.5±8.8|10.6±2.9|14.8±6.0|12.6±6.6|18.2±6.6|18.2±10.3
Cytoplasmic Vacuolar Area (um2)|0.63±0.47|0.68±0.65|0.38±0.44|0.15±0.16|0.92±0.92|0.49±0.63|1.30±0.88|0.92±1.00|0.78±0.27|l.l0±0.82
Glutl Immunogold Particles | | | | | | | | | |
Total Number per Capillary profile|889±401|126±729|1336±499|1410±774|904±425|879±320|713±389|565±184|1281±558|797±533
per um luminal membrane|20.9±6.3|24.1±9.|30.3±12.9|28.6±8.5|20.1±5.2|22.±4.9|15.5±5.3|14.5±2.5|23.0±4.5|15.1±6.1
per um abluminal membrane|10.5±4.6|13.5±5.6|15.9±4.7|17.5±6.5|10.7±3.0|13.2±2.8|8.5±2.8|8.1±1.4|13.1±2.1|7.4±2.2
Ratio of Luminal:Abluminal AU/um|2.08±0.41|1.82±0.29|1.96±0.76|1.73±0.42|1.94±0.46|1.70±0.27|.86±0.42|1.81±0.25|1.75±0.20|2.04±0.35
Endothelial Cytoplasm per um2|28.0±12.3|26.0±13.9|30.4±11.0|39.3±19.4|25.1±9.1|31.9±12.7|22.9±13.8|25.7±8.4|35.4±8.3|17.2±5.9
Pericyte/Basal lamina per um2|2.0±1.6|2.3±1.4|2.3±1.6|2.5±0.3|3.3±2.0|3.9±1.8|2.8±1.1|2.2±0.8|4.7±2.7|3.9±3.8
(J Cereb Blood Flow Metab, Vol. 18, No.1, 1998)
ID:(8922, 0)
Type B capillary profile double stained
Imagen
Type AB capillary profile double stained:
The characteristic appearance of a type AB capillary profile double stained with 10-nm-immunogold-Glut1 and 20-nmimmunogold-Iabeled G FAP from the more actively spiking region of a temporal lobe resection. This capillary profile demonstrates that in contiguous endothelial cells (separated by an intercellular cleft), Glut1 glucose transporter immunoreactivity can vary between two extremes; abundant and minimal. Note that the Glut1 glucose transporter epitopes are abundant on only a sector of the capillary circumference, comprising the type A endothelial cell on the left side of the profile (and the interendothelial clefts at the 6- and 12-0'clock positions). The remainder of the sector (formed from an adjacent, contiguous type B endothelial cell) shows only a very few Glut1 glucose transporter epitopes, and relatively more on the abluminal than luminal membrane. Scale bar = 0.5 um.
(J Cereb Blood Flow Metab, Vol. 18, No.1, 1998)
ID:(8913, 0)
Analysis of Type B
Descripción
TABLE 2. Analyses of Type B (low-reactivity) capillaries: Endothelial cell parameters in the interictal state
Parameter | Case 1 | | Case 2 | | Case 3 | | Case 4 | | Case 5 |
----------|--------|------|--------|------|--------|------|--------|------|--------|------
- | More active | Less active | More active | Less active | More active | Less active | More active | Less active | More active | Less active
- | EEG site | EEG site | EEG site | EEG site | EEG site | EEG site | EEG site | EEG site | EEG site | EEG site
Abluminal Membrane Length um|22.9±9.9|19.9±3.6|19.7±6.1|19.5±5.8|16.1±2.7|21.2±7.1|17.9±0.9|14.9±1.6|17.6±4.2|15.2±3.0
Luminal Membrane Length um|19.5±9.0|18.1±3.8|17.3±5.8|15.1±5.4|14.4±2.2|17.7±4.2|15.6±2.2|7.3±2.0|7.1±1.3|8.2±6.6
Net Cytoplasmic Area (um2)|7.9±4.0|4.5±1.7|5.6±2.4|3.9±1.5|3.3±0.8|5.9±2.4|5.7±1.6|12.8±1.6|14.6±3.9|13.9±3.6
Area of Capillary Lumen (um2)|17.2±15.8|15.9±7.8|13.6±11.0|13.0±6.6|8.3±0.9|16.4±8.2|13.6±5.2|5.1±1.8|4.5±0.6|7.5±0.1
Endothelial Cell Thickness nm|427±58|317±103|303±96|258±71|300±71|284±99|316±15|329|421±17|666±197
Basal LaminaiPericyte Area (um2)|16.1±6.0|7.5±2.2|6.6±3.4|8.6±5.4|6.3±1.5|13.8±4.8|10.4±4.2|7.9±0.6|7.5±1.6|10.2±1.4
Cytoplasmic Vacuolar Area (um2)|0.76±0.50|0.41±0.31|0.19±0.18|0.28±0.17|0.31±0.27|0.19±0.19|0.91±0.47|0.18±0.01|0.68±0.02|1.53±1.55
Glutl Immunogold Particles | | | | | | | | | |
Total Number per Capillary profile|119±100|64±38|61±29|59±34|55±8|140±63|107±82|51±3|166±172|160±65
per um luminal membrane|3.1±4.9|0.6±0.4|0.9±0.5|1.0±0.8|0.8±0.3|2.9±2.8|2.8±2.3|1.1±0.1|6.0±6.3|4.0±1.8
per um abluminal membrane|2.0±1.9|1.7±0.5|1.8±0.8|1.7±0.8|2.0±0.5|3.4±1.8|2.3±2.1|2.0±0.1|3.6±3.4|2.3±1.2
Ratio of Luminal:Abluminal AU/um|1.13±0.98|0.37±0.16|0.52±0.30|0.55±0.28|0.40±0.07|0.74±0.33|1.27±0.12|0.57±0.06|1.55±0.31|1.76±0.82
Endothelial Cytoplasm per um2|4.1±3.1|3.2±1.9|2.1±0.9|2.8±1.9|3.2±1.3|5.4±3.2|3.2±1.0|1.3±0.4|9.9±8.9|8.6±5.7
Pericyte/Basal lamina per um2|0.7±0.5|1.0±1.3|0.7±0.4|0.5±0.4|1.2±0.8|1.6±1.1|1.9±1.6|1.8±0.7|0.9±0.3|1.5±1.5
(J Cereb Blood Flow Metab, Vol. 18, No.1, 1998)
ID:(8921, 0)
Type S capillary profile double stained
Imagen
Type S capillary profile double stained:
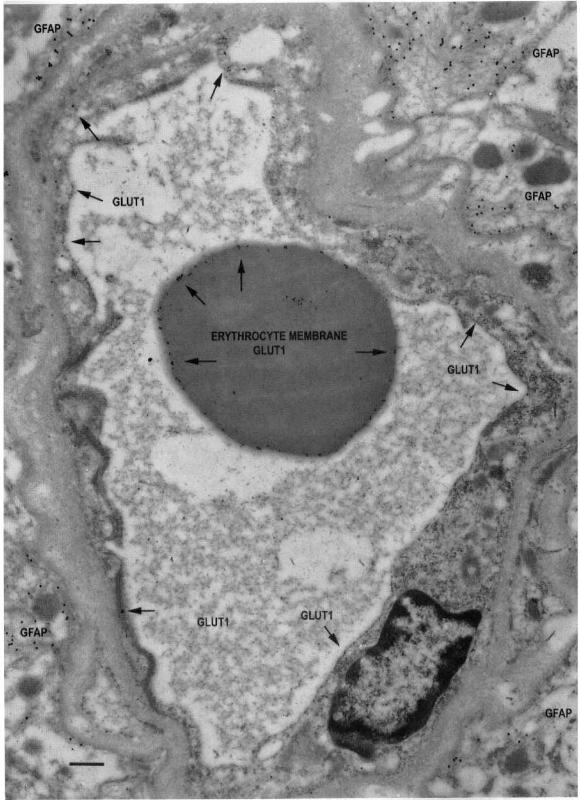
The typical appearance of a type S, minimally reactive capillary profile, double stained with 10-nm-immunogold-Glut1 and 20-nm-immunogold-labeled G FAP. This capillary is from the more actively spiking region of the resection, and many G FAP-positive fibrils can be seen outside the capillary basal lamina. Note the low G lut1-immunogold density (arrows) throughout the capillary profile, suggesting downregulation of Glut1 glucose transporter activity in all of the endothelial cells that contribute to this profile. Within the capillary lumen, high Glut1 immunoreactivity is seen on the erythrocyte membrane; this serves as a positive control and suggests that the loss of Glut1 from endothelial membranes is a biologically induced phenomenon, and not an artifact of tissue preparation or staining. Scale bar = 0.5 um.
(J Cereb Blood Flow Metab. Vol. 18, No. 1, 1998)
ID:(8914, 0)
Human serum albumin (HSA) epitopes
Imagen
Human serum albumin (HSA) epitopes
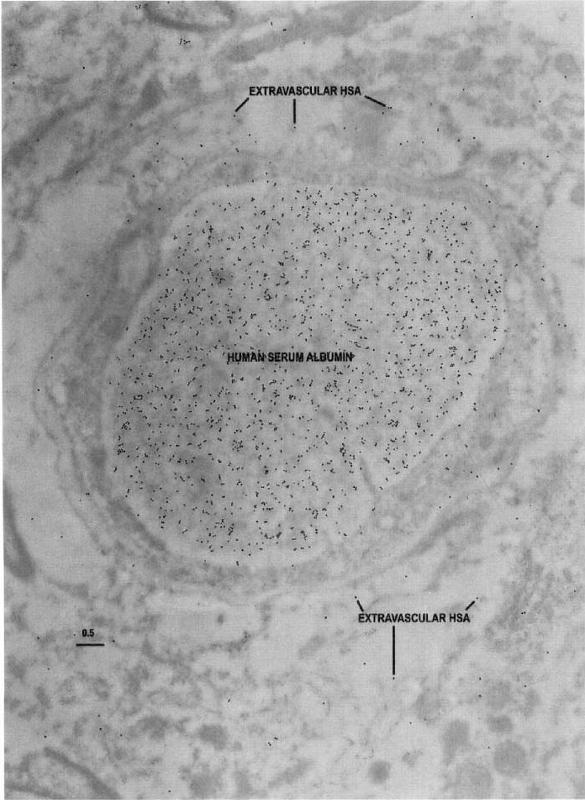
Electron microscopic identification of human serum albumin (HSA) epitopes are used here as an indicator of blood-brain barrier integrity in resected tissue. Note that in this capillary profile from the region of the resection judged from intraoperative EEG to be least actively spiking, the majority of the HSA epitopes are localized within the capillary lumen, with only a few epitopes in the capillary and
neuropil. Scale bar = 0.5 um.
(J Cereb Blood Flow Metab, Vol. 18, No. 1, 1998)
ID:(8915, 0)
HSA epitopes taken from the more actively spiking region
Imagen
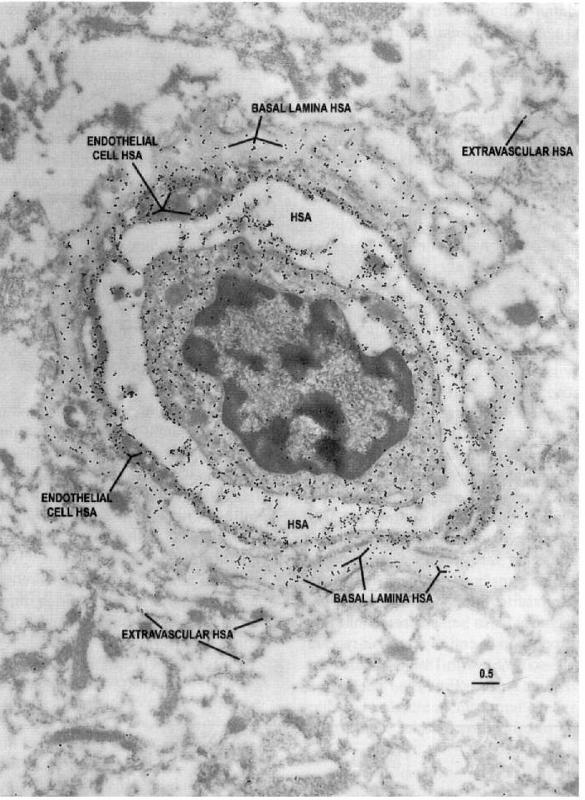
Human serum albumin (HSA) epitopes taken from the more actively spiking region
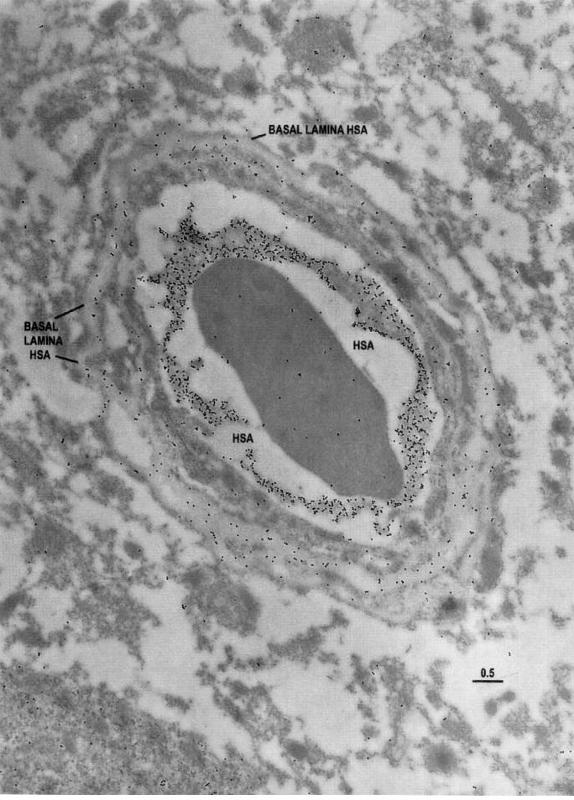
Electron microscopic identification of HSA epitopes in a capillary profile taken from the more actively spiking region as indicated by intraoperative EEG analyses. Note that there is some extravasation of HSA into the neuropil. Also, there are HSA epitopes within the basal lamina, suggesting that extravasation of the albumin may be impeded (perhaps by a sievelike mechanism). Scale bar = 0.5 um.
(J Cereb Blood Flow Metab. Vol. 18, No. 1, 1998)
ID:(8916, 0)
HSA epitopes taken from the more actively spiking region (2)
Imagen
Human serum albumin (HSA) epitopes in a capillary profile from the more actively spiking region:
Electron microscopic identification of HSA epitopes in a capillary profile from the more actively spiking region of the seizure resection. Note the extensive extravasation of HSA into the endothelial cell and pericyte-basal lamina, as well as the surrounding neuropil, suggesting that the barrier function is compromised in this region of the brain. Scale bar = 0.5 um.
(J Cereb Blood Flow Metab, Vol. 18, No.1, 1998)
ID:(8917, 0)
Compartmental glucose dynamics in the neuropil
Imagen
Compartmental glucose dynamics in the neuropil
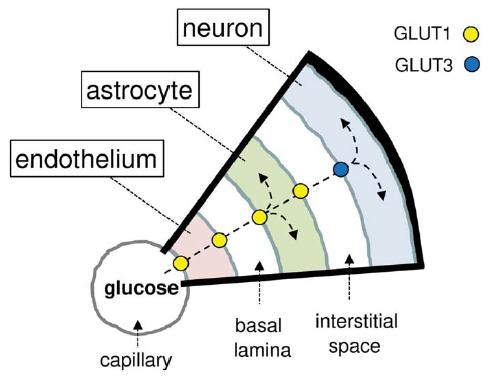
Compartmental glucose dynamics in the neuropil. Glucose crosses the capillary endothelium via the facilitative glucose transporter GLUT1 and then enters astrocytes also via GLUT1. Astrocytes metabolize some glucose and export the remaining fraction to be internalized via GLUT3 and metabolized by neurons. The driving force for the flux of glucose into the brain is glucose metabolism.
(Journal of Neuroscience Research, Barros et al.)
ID:(8918, 0)
Representation of possible solution
Imagen
Representation of possible solution
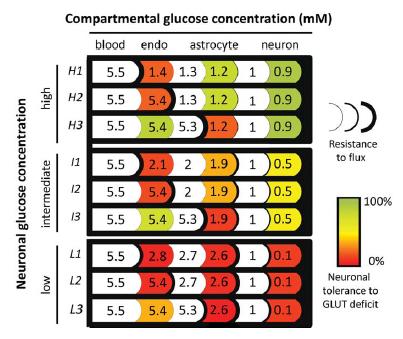
GLUT1 is near-critical for neuronal glucose consumption in the steady state. Each of the nine rows represents a possible solution consistent with experimentally observed interstitial glucose (1mM) and average tissue glucose (also 1mM). Examples are given at high (H), intermediate (I), and low neuronal glucose concentrations (L). For each of these three neuronal glucose levels, three examples are given where most of the flux resistance is either at the luminal side of the endothelium (H1, I1, and L1), at the adluminal side (H2, I2, and L2), or in the astrocytic membrane (H3, I3, and L3). Tissue glucose consumption was split between astrocytes and neurons, with 3.25 lM/sec each (Barros et al., 2007; Nehlig and Coles, 2007). The sensitivity to GLUT deficit was determined by numerical modeling of F3 glucose flux (explained in the legend to Fig. 3) and illustrated as the percent reduction in the GLUT permeability constant in each cell type required to fully deplete neurons of glucose: warmer colors indicate more sensitivity to GLUT deficit.
(Journal of Neuroscience Research, Barros et al.)
ID:(8919, 0)
GLUT1 stimulation
Imagen
GLUT1 stimulation:
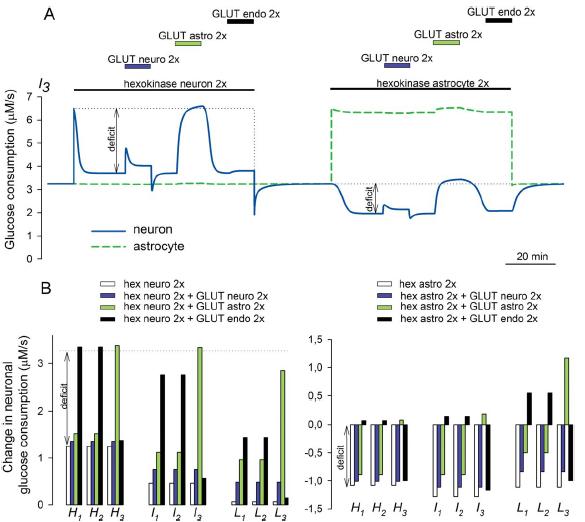
GLUT1 stimulation is required to sustain neuronal metabolism during increased demand. Glucose dynamics were simulated for the I3 configuration (see Fig. 2) using Berkeley Madonna and a simplified version of the compartmental model described in Barros et al. (2007), with GLUT-mediated permeation modeled as a linear reversible mechanism represented by a single permeability constant. GLUT permeability constants are the reciprocal values of the resistances color coded in Figure 2 (I3). Glucose consumption rates of 3.25 lM/sec were assigned to both astrocytes and neurons (Barros et al., 2007; Nehlig and Coles, 2007). Respective fractional volumes were 0.0001, 0.0001, 0.25, 0.20, and 0.45 for endothelium, basal lamina, astrocyte, interstitial space, and neuron. Hexokinase was modeled with a Km of 50 lM. A: Activity-dependent metabolic demand was simulated as a sustained 100% increase in the Vmax of hexokinase, first in neurons and then in astrocytes. Neuronal, astrocytic, and endothelial GLUT stimulations were simulated as 100% increases in the respective permeability constants. The difference between target and glucose flux is indicated as “deficit.” B: Summary of similar simulations for the nine configurations in Figure 2, with bars showing the increase in flux resulting after stimulation of neuronal hexokinase and GLUTs (left panel) and after the stimulation of astrocytic hexokinase (right panel).
(Journal of Neuroscience Research, Barros et al.)
ID:(8920, 0)